


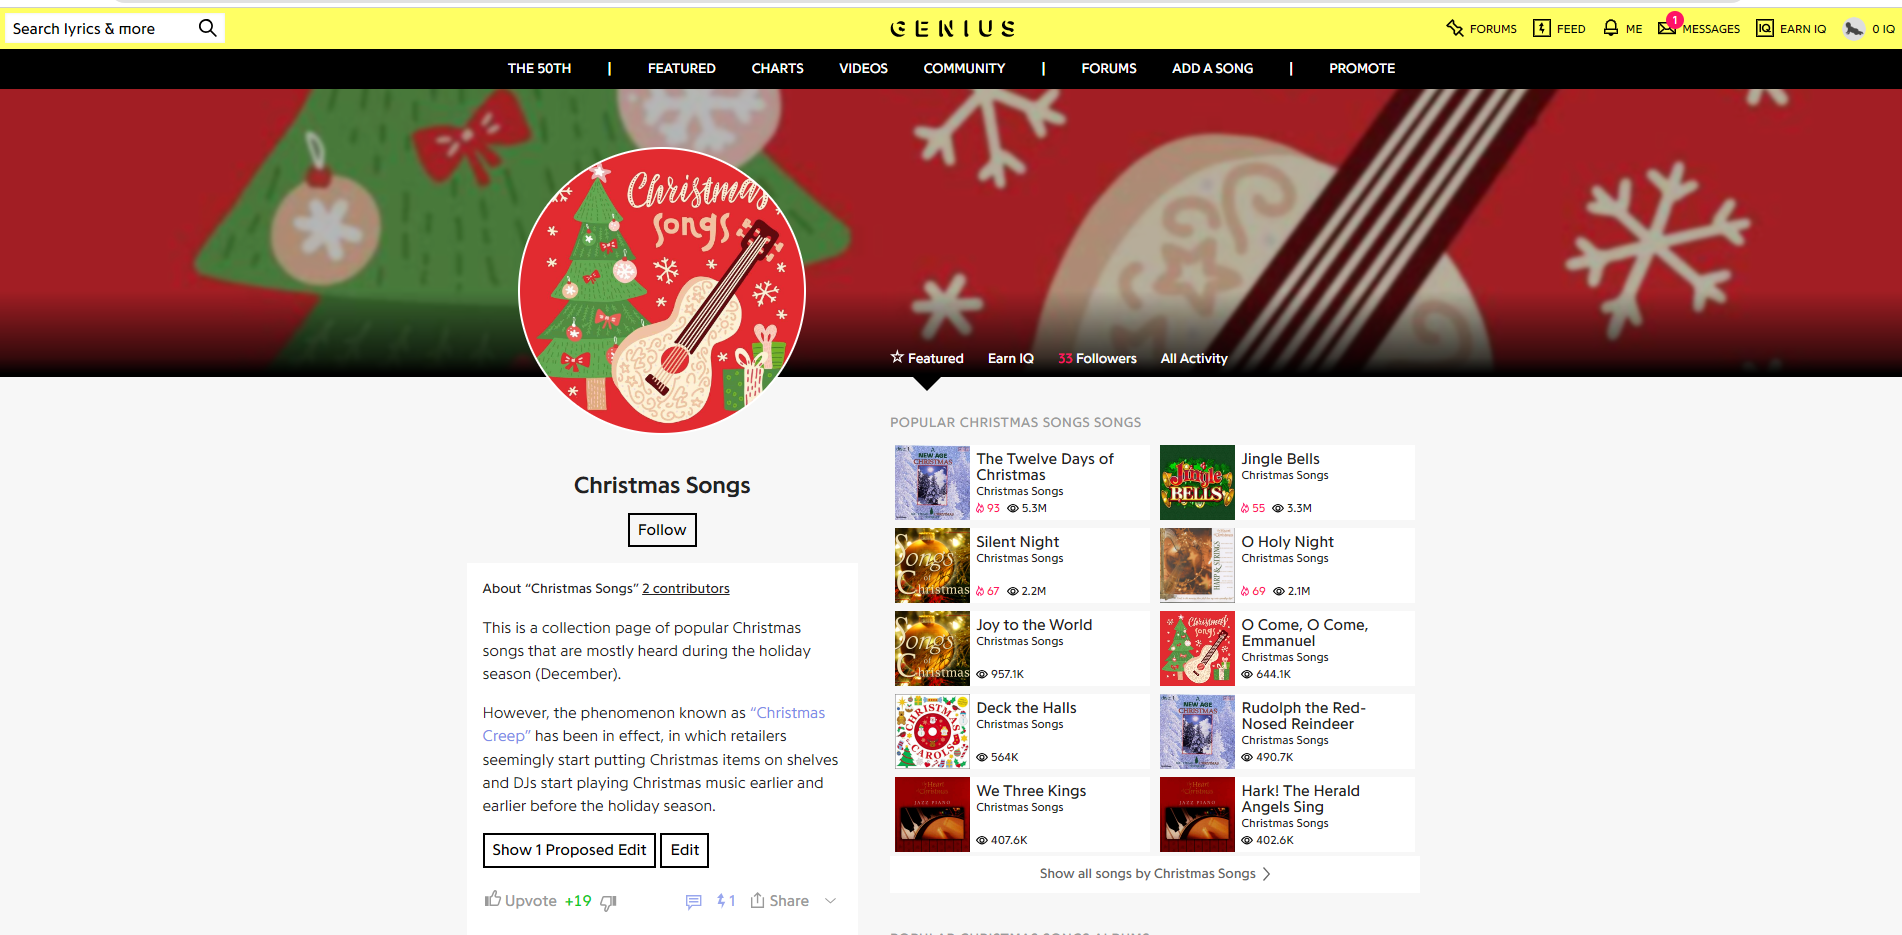
The DSNY 5 team was assigned to work with the Genius API on the third day of the dashboard week. Genius API is the page where the user can search for song lyrics. Michael McFadden listened to Christmas songs, so I would like to help him find some Christmas songs and lyrics.
On the second day of the dashboard week, I worked with web-scraping to extract the data from the webpage. On this second day of the dashboard week, I work with API. In my point of view, extracting data from API is much easier than extracting from web-scraping. The structure of the data in API is usually in JSON format with the key and value.
Same as other dashboard week blogs that I wrote. I will list all the steps that I did on this project. There is a little difference from other dashboard week blogs. The steps include:
1/ Research the API documentation page and register to get access token
2/ Send a GET request to get data from API and clean/ prepare data in Alteryx
3/ Sketch a draft on Excalidraw
4/ Build visualization on Tableau Desktop
5/ Test and publish the dashboard on Tableau Public
1/ Research the API documentation page and register to get access token
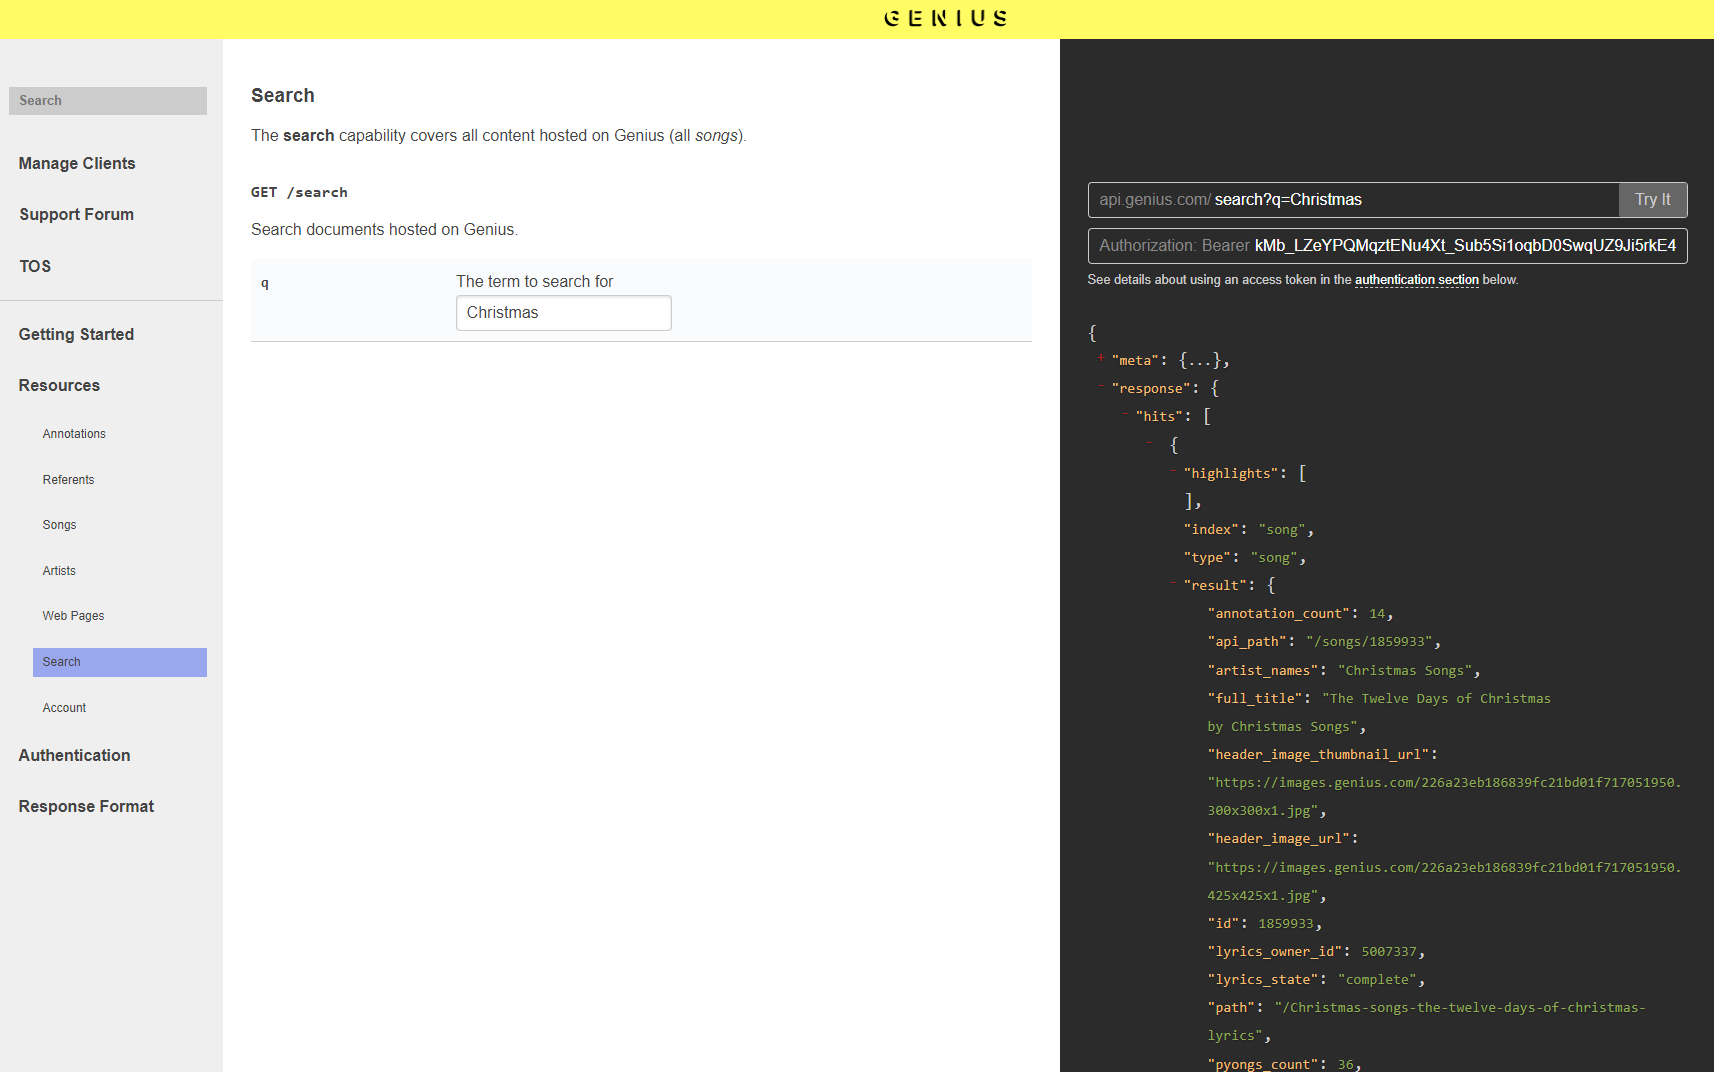
Before sending any requests to GET/ PUT/ POST data from the API, I always look at the API documentation page first. My goal is to extract the data about the "Christmas" word from API. On the left pane, I click on the Search menu. It navigates me to the Search section. When I type the "Christmas" word on the box to search, the right pane will show the URL and the access token. Below that box is the result in JSON format (Image 2). That's great!
However, when I use that access token in Alteryx, it doesn't work for me. Therefore, I used another page to get the access token. I accessed this page https://genius.com/api-clients to get the client access token.
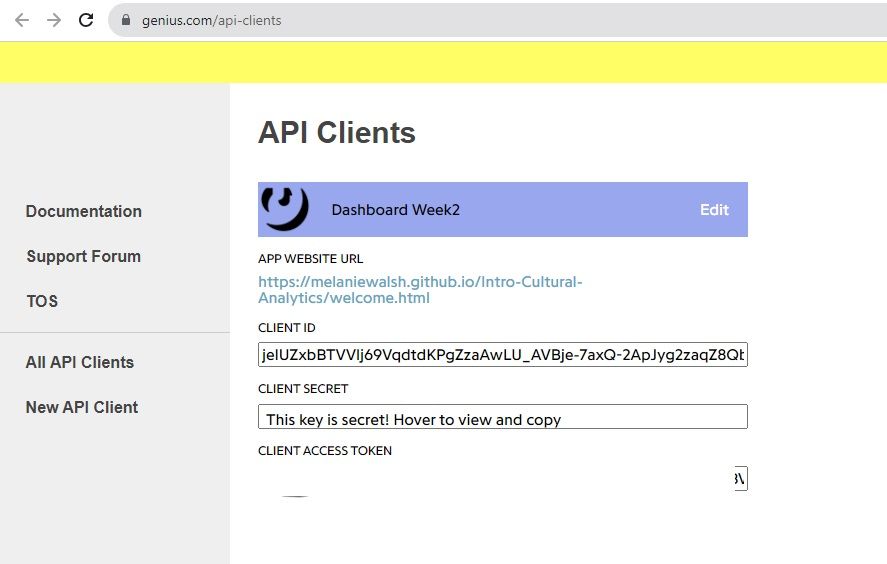
Now, I know the URL that I am working on is: https://api.genius.com/search?q=<search words> and the access token. I'm ready to open Alteryx to extract the data from the API.
2/ Send a GET request to get data from API and clean/ prepare data in Alteryx
To extract the data from the API, I need to have a URL first. The structure of the URL is:
'https://api.genius.com' + 'search?q=' + [search_quote] +[token] + '&page=' + ToString([page])
where [search_quote] is "Christmas", [token] is my access token, and [page] is the number of pages from 1 to 100.
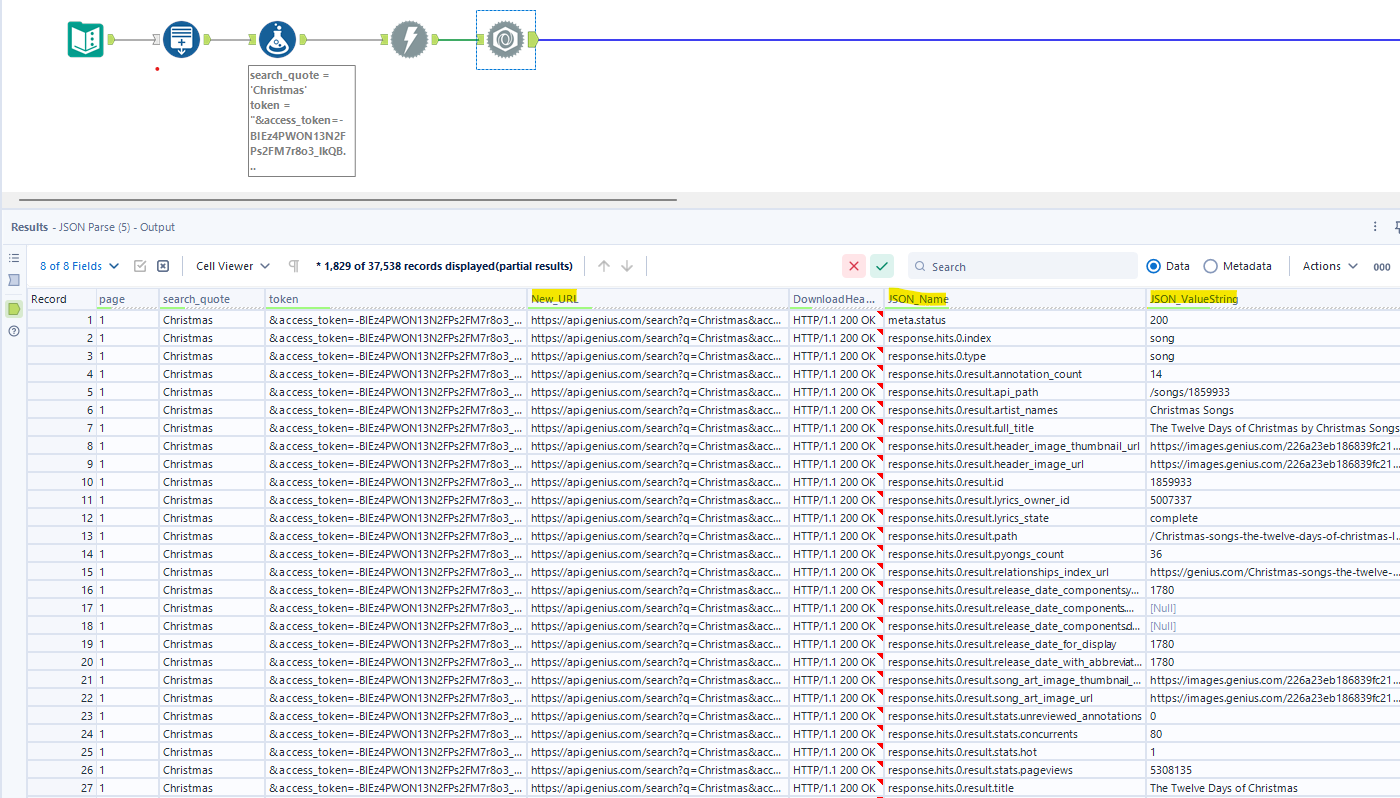
I use Generate Row tools to generate page values from 1 to 100. Then, assign the page number as a parameter to the URL. After that, I use the Download tool to send the GET request to extract the data from the API. I also use the JSON Parse tool to parse the downloaded data. In the result of Image 4, there are 2 columns JSON_Name and JSON_ValueString.
In the JSON_Name column, the value includes the id and the title. Therefore, I need to use the RegEx tool to get the ID and the title.
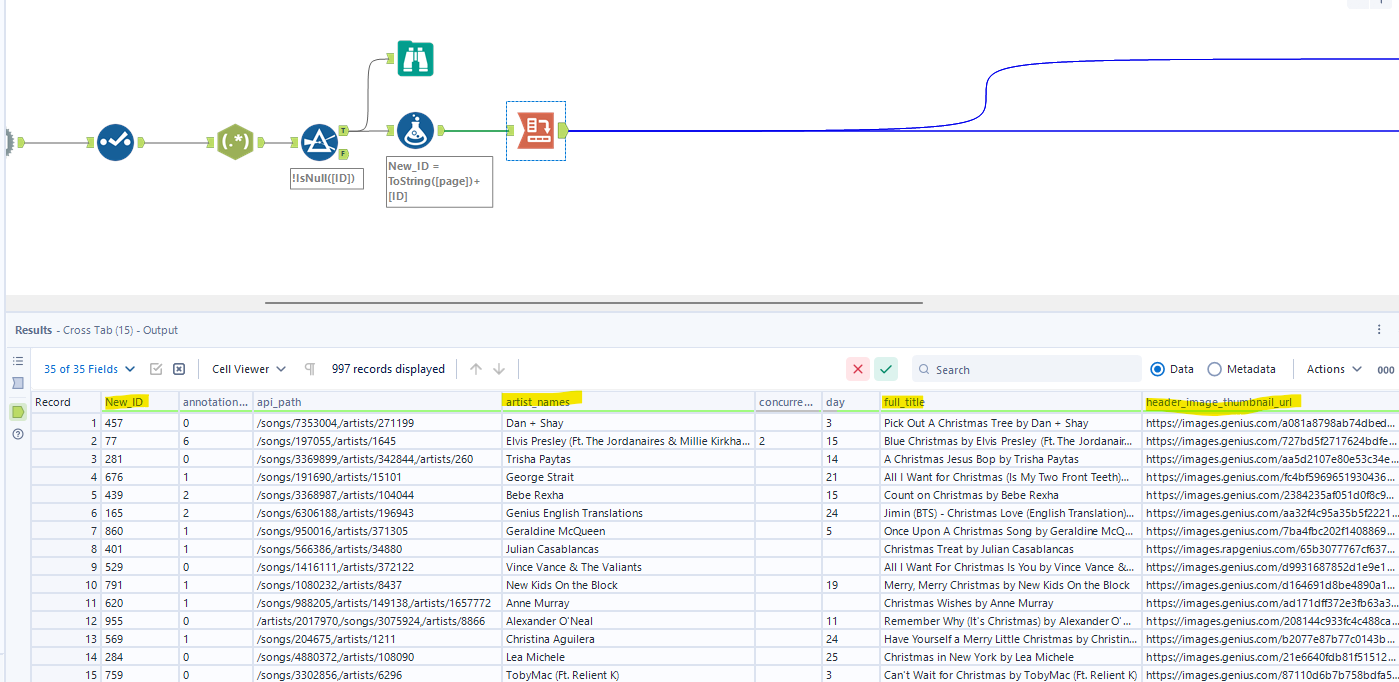
Each page in the result includes 10 IDs (from 0 to 9) for 10 songs. However, if the page changes, there are another 10 IDs (also from 0 to 9) for another 10 songs. It will cause a problem if I would like to transform the data. To solve that problem, I concatenate the page number and the ID from JSON_Name. The New_ID field = [page]+[ID]. Now, I can use the Cross Tab tool to group by my New_ID field. (Image 5)
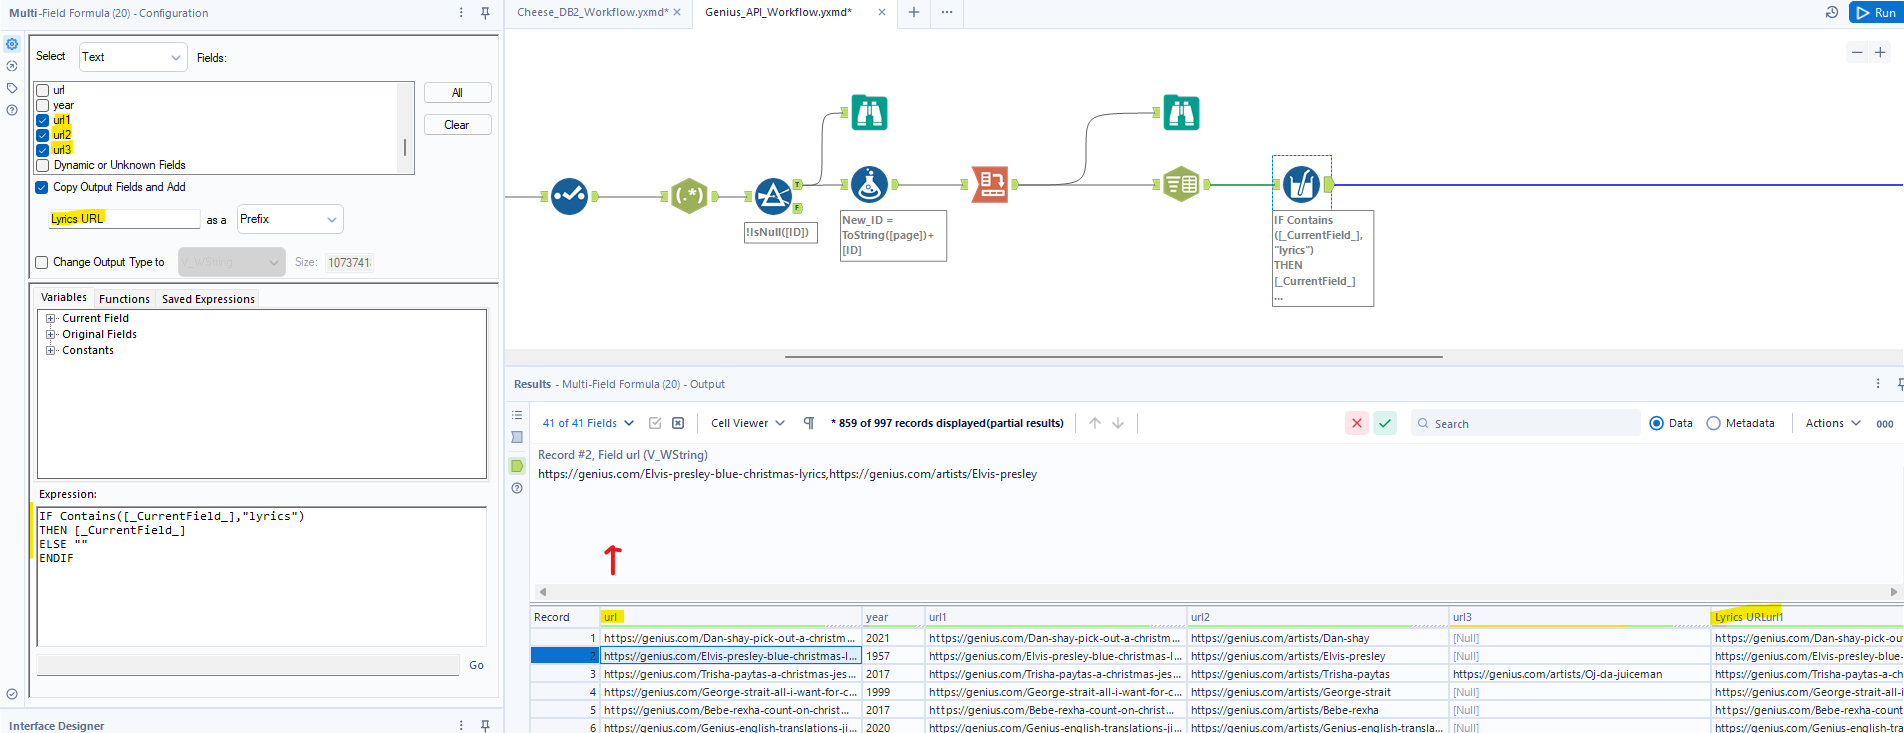
There are many URLs in the URL field. It could include the URL lyrics and URL of the artist or the album and no order (the song lyrics URL could be on the top or at the end) in the URL field. However, I only want to get the URL song lyrics URL. To do that, I have to split the URL field into columns. Then, I use the Multi-Column Formula to check if one of the URL columns contains the word "lyrics", I will keep it. Otherwise, I will leave it as a blank.
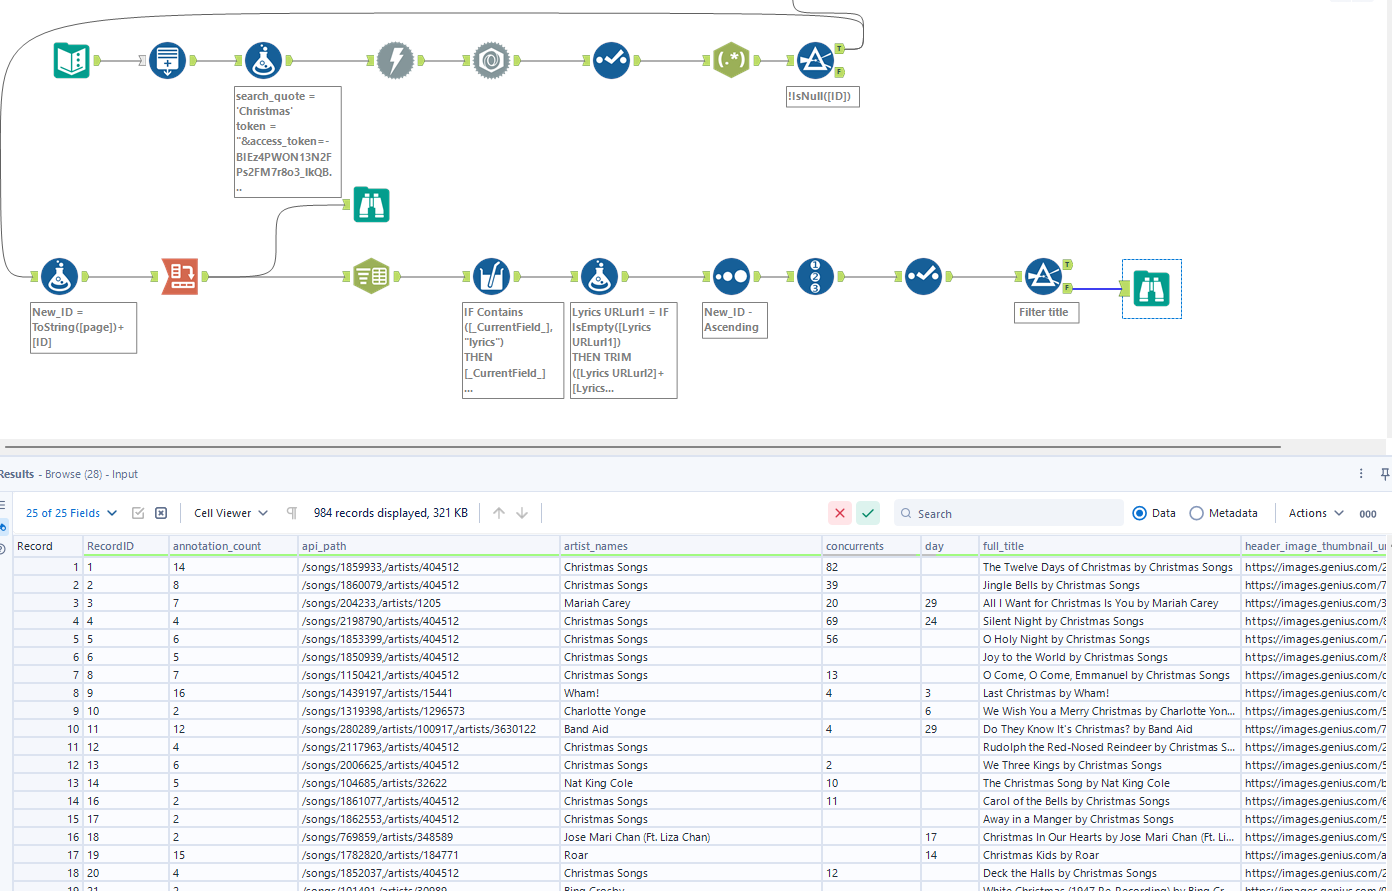
In the final steps, I sort the new_ID in ascending order, then create a new record ID, remove unnecessary columns, and filter some unrelated Christmas songs.
After I output the data file, I am going to go to the next step to sketch my idea.
3/ Sketch a draft on Excalidraw
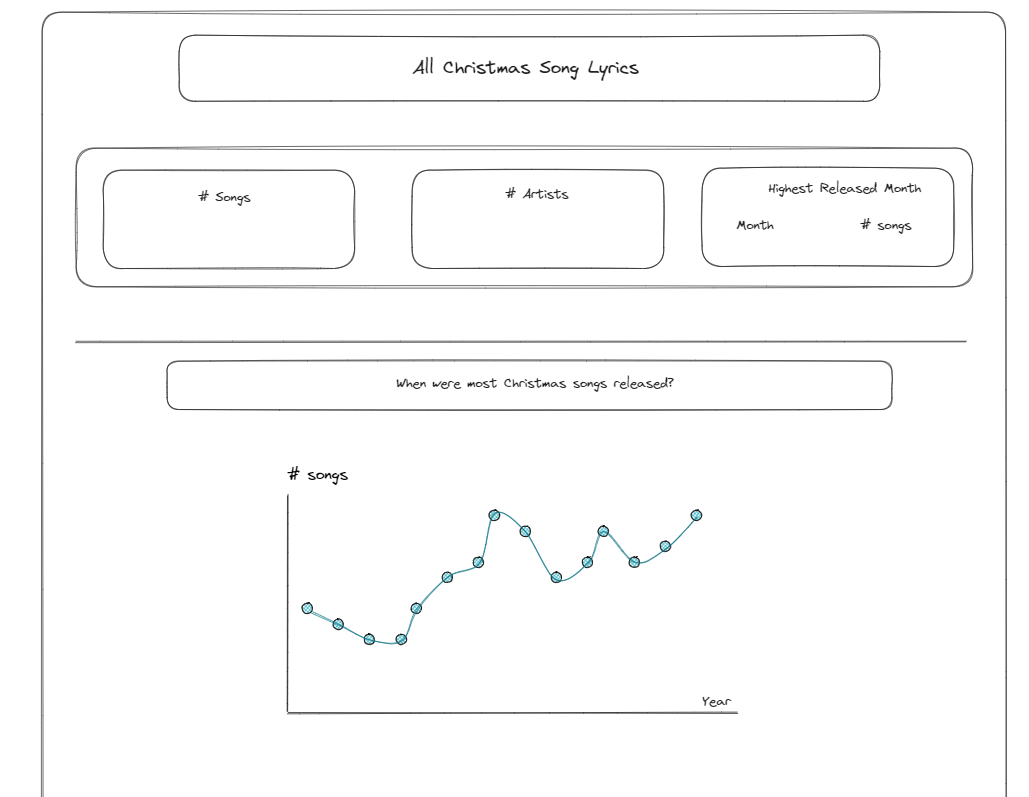
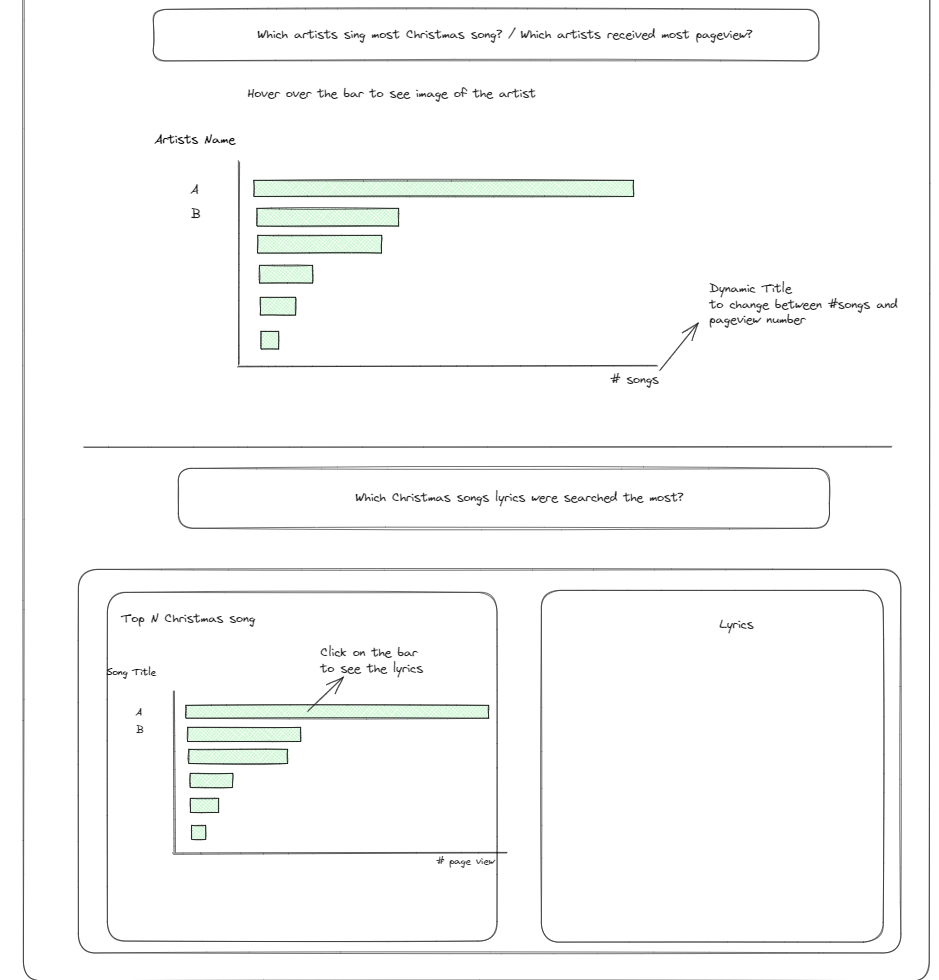
After preparing the data in Alteryx, I started sketching the structure of the dashboard on Excalidraw. I would like to tell the story, so I chose to build the dashboard in vertical. The audience could follow the story and explore the data from the top to the bottom.
From the top of the dashboard, I summarize how many songs and artists in the dataset that I am working on. Also, I show which month the most songs were released and the number of songs. Then, the line chart shows the trend of the number of songs released. In the next bar chart, I summarize which artists sing most of the Christmas songs. In the last section, the bar chart on the left side shows the top Christmas songs based on the view number. If the audience clicks on the title of the song, then it will show the lyrics of that song on the right.
4/ Build visualization on Tableau Desktop
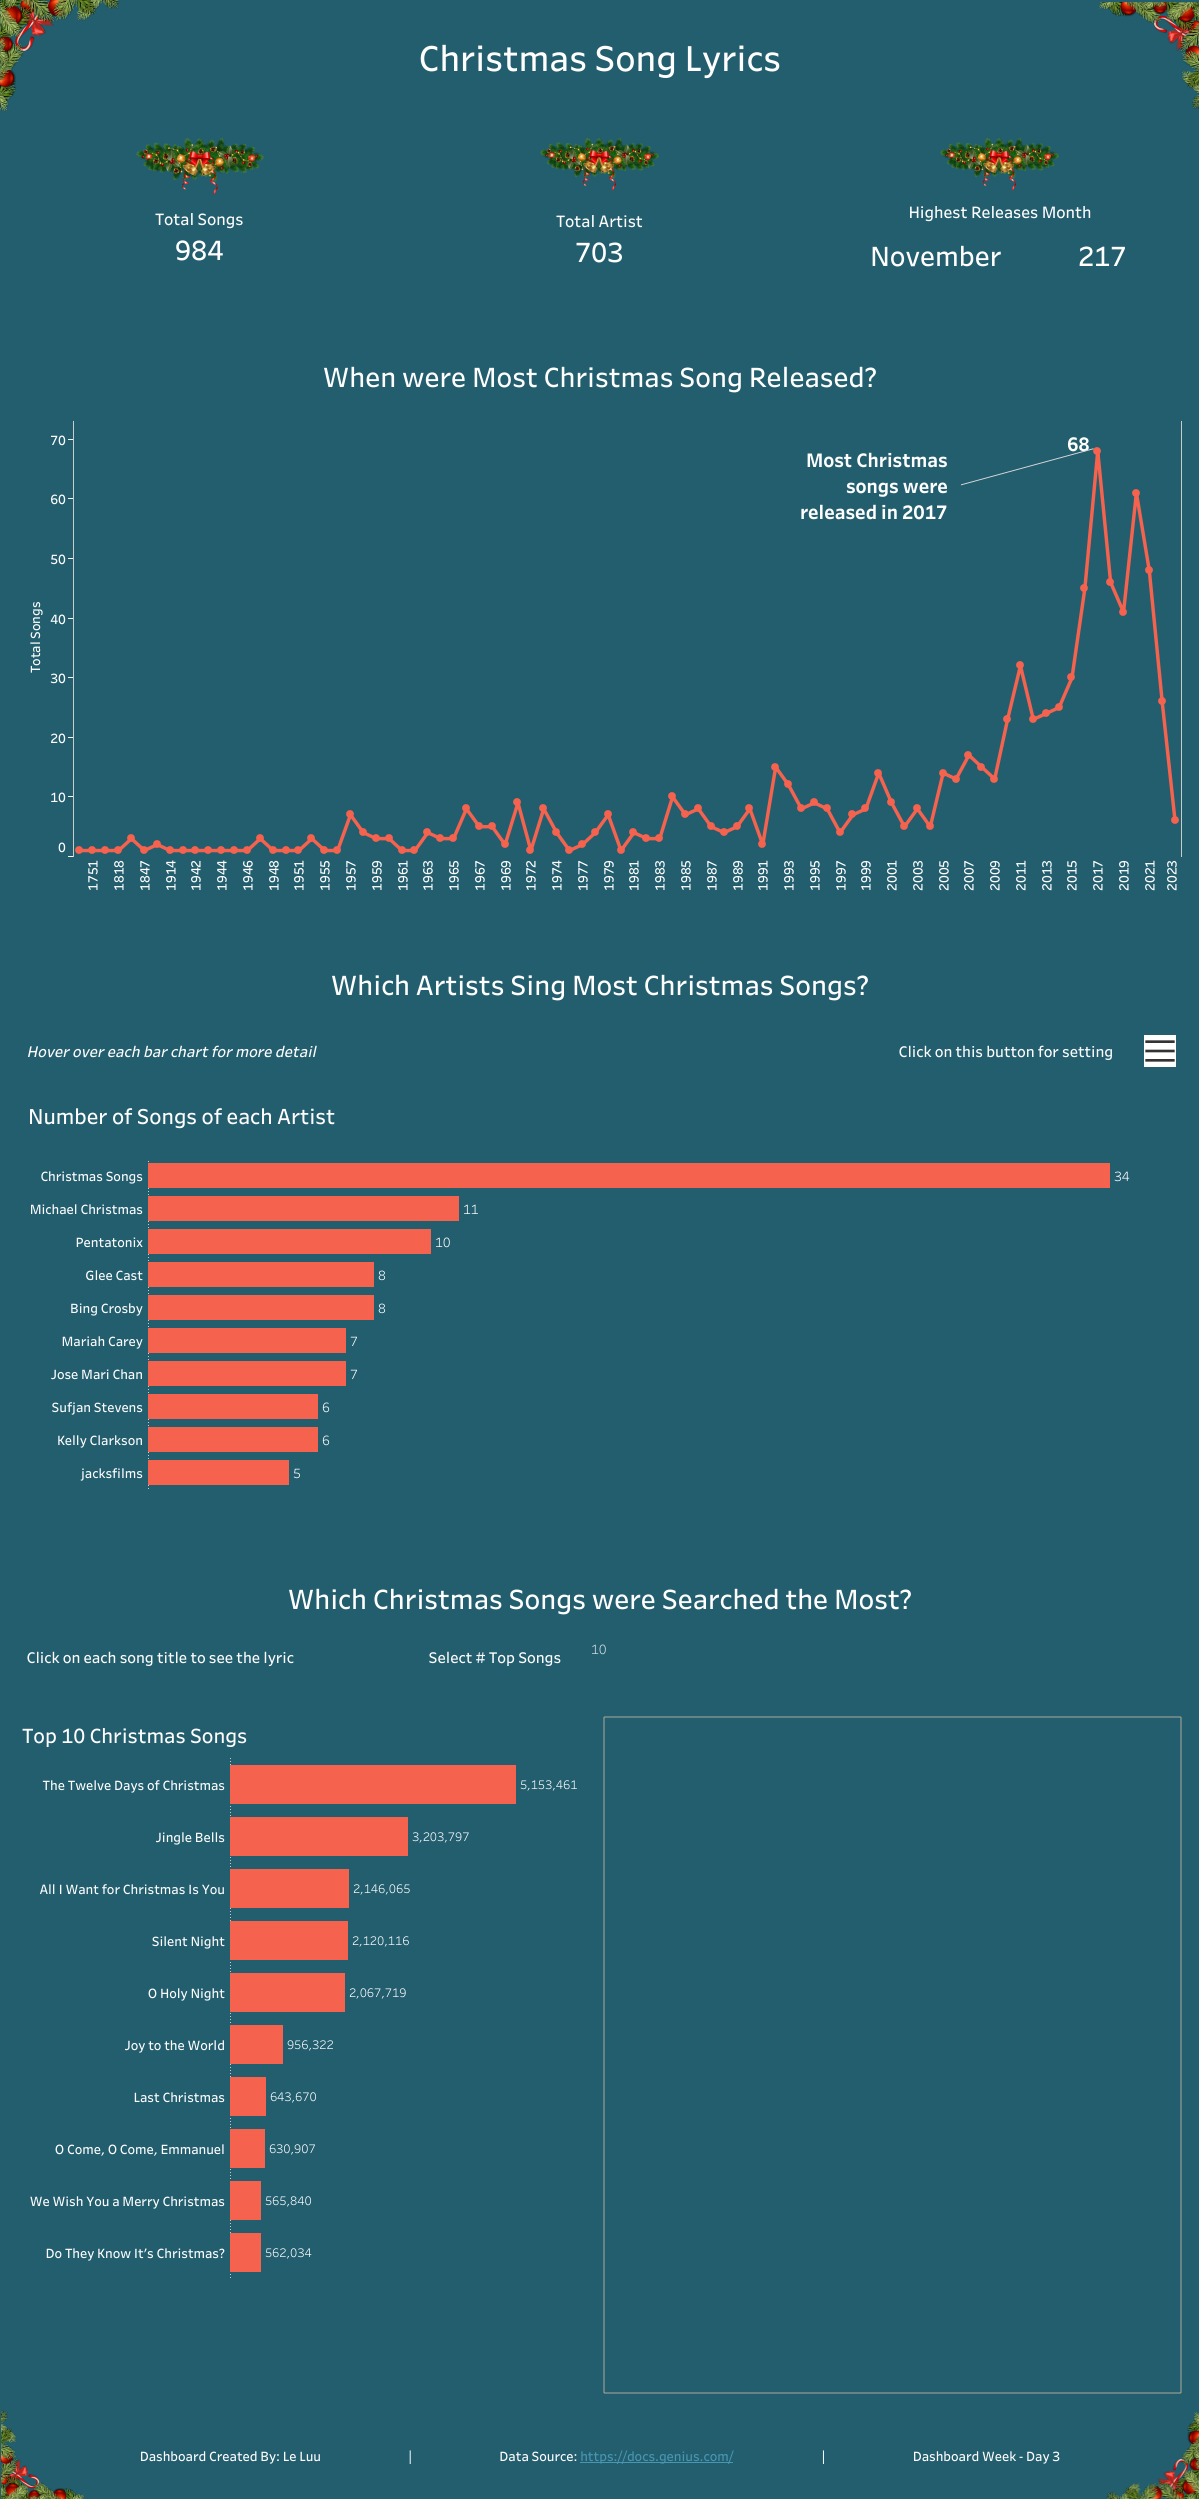
Based on the sketch, I can build the BANs, and visualization on Tableau Desktop. For the highest releases month, I used table calculation to figure out which month the most songs were released and how many songs were released in that month.
The next line chart shows which year most Christmas songs were released from 1751 to 2023. (Image 10)

For the second part of the dashboard, I used the bar chart to show the top artists who performed most Christmas songs. The user can change the view by clicking on the button to change the number of songs of each Artist to the number of average views by each artist. The user can change the top number from that setting as well.

In the last bar chart at the bottom, I compare the number of views by each Christmas song. The user can change the number of top songs (By default, it is set to 10). If the user clicks on the title of the song on the bar chart, it will show the lyrics on the right (Image 11).
5/ Test and Publish the dashboard on Tableau Public
Before uploading the dashboard on Tableau Public, I will check the action, filter, and tooltip to make sure everything works as I expected. The webpage works well on Tableau Desktop. However, Tableau Public cannot show the webpage. I think if I have more time on this project, I will extract the lyrics data in Alteryx. Then, the dashboard would look better.
Dashboard link: https://public.tableau.com/views/Dashboard_Week_day3_Christmas_Song/ChristmasSongLyrics?:language=en-US&:display_count=n&:origin=viz_share_link
That's all for my dashboard week day 3. I hope you enjoy this blog and pay attention if you are planning to show the webpage on Tableau Public.
See you in the next blog and Happy Holiday!