


In Alteryx, users usually use the Spatial tools in the Spatial palette to work on the data related to the Spatial data. I wrote 2 blogs to share how to apply the Spatial tools in Alteryx to solve the problem (Part 1, Part 2). Besides the Spatial tools, the user can analyze the demographic data (in race, ethnicity, household, income, poverty, ...) in Alteryx by using Demographic Analysis tools.
In this blog, I will share the features of each tool and how to use Demographic Analysis tools to retrieve demographic data without web-scrapping data or retrieving data from API on the Internet. Then, I will demo how to apply the tool in a use case.
As you notice, the name Demographic Analysis tool starts with the word "Allocate". Those tools help to extract data utilizing the Allocate Engine within Alteryx. To use those tools, you must have a license to install them. You can read more details about those tools here.
1/ Allocate Input tool
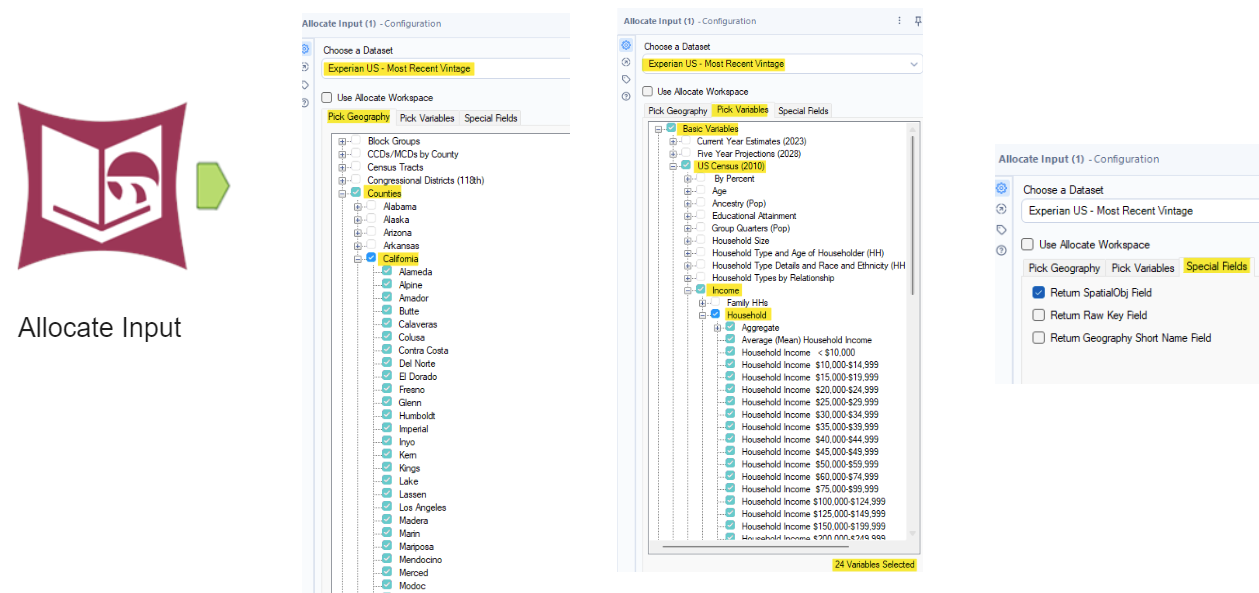
The Allocate Input tool allows you to extract the data from the installed dataset. The Allocate Input tool only has 1 output anchor with no input anchor. There are 3 tabs (Pick Geography, Pick Variables, and Special Fields) in the Configuration window.
Those tabs allow you to choose many options to extract data. For example, I want to compare the household income of all counties in California.
- Drag the Allocate Input tool from the Demographic Analysis palette into canvas
- Click on the Allocate Input tool to open the Configuration window
- Choose an installed Dataset from the dropdown menu (the dataset is downloaded from the Data package)
- In the Pick Geography tab, you can expand/ collapse the tree menu. In this example, I check Counties and the California state
- In the Pick Variables tab, I expand the Basic Variables option and check Income, Household
- In the Special Fields tab, I check Return SpatialObj Field to return the Polygon Spatial Object of each county
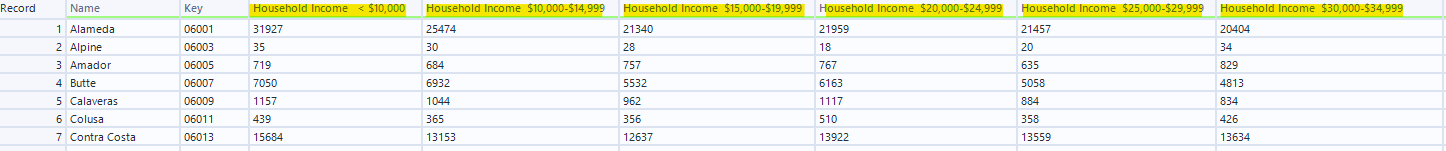
Then run the workflow. The result table will return 27 fields which include 24 variables selected from the Pick Variables tab and 3 fields (Name, Key, SpatialObj). 58 records represented 58 counties in California state.
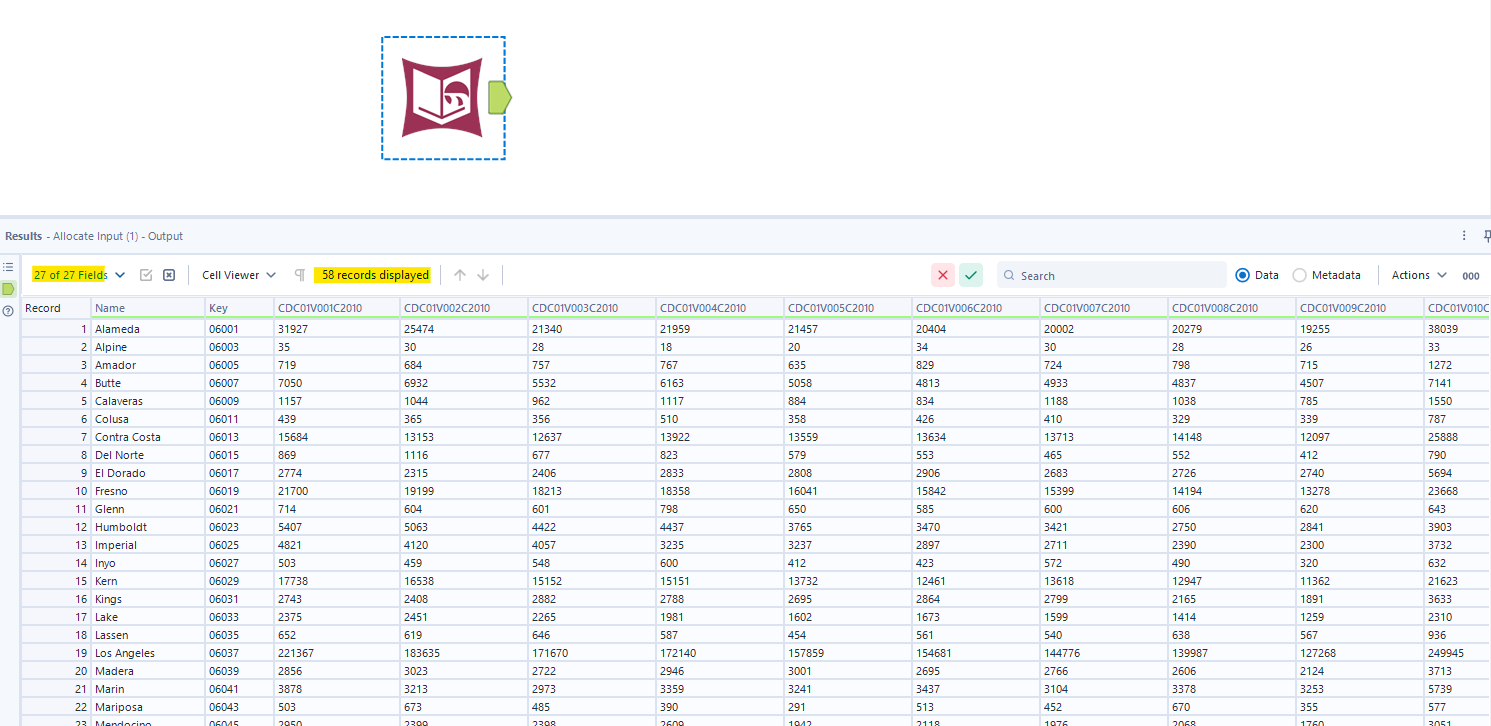
Note that 24 variable fields have the code name as the header. It's hard to understand the data in each column is showing. But I will show how to translate it into the description header name in the next tool.
2/ Allocate Metainfo tool
The Allocate Metainfo Tool returns the meta information of the installed datasets. The meta info that the tool can return from:
- Datasets
- Geography Levels
- Index Base Files
- Reports
- Variables
- Version
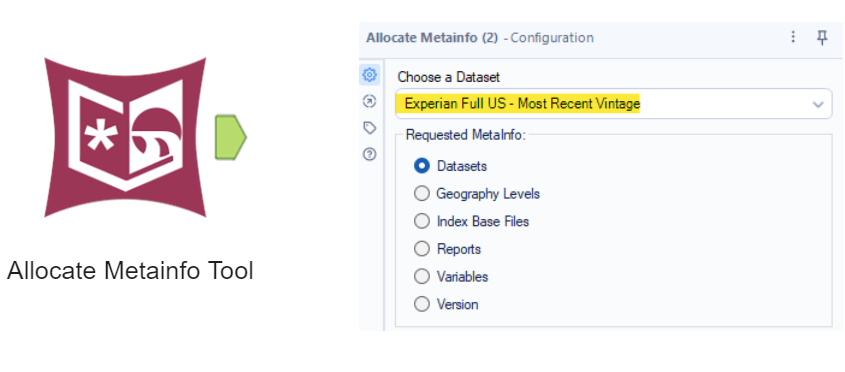
Datasets: this option will return the list of installed allocated datasets in short and long names.

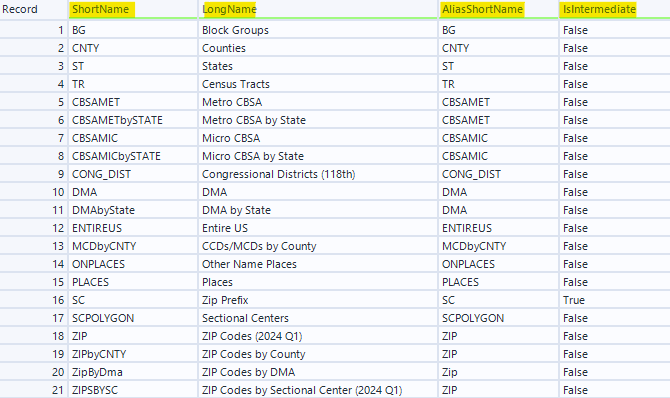
Geography Levels: This option returns the data in the Geography level from the selected installed dataset. There are 4 columns in the result table: ShortName, LongName, AliasShortName, and IsIntermediate.
Index Base Files: return the list of Index Base Files (.ibs)
Reports: return the list of the installed report files (.rpts). The report file is located in the Data/Report folder where the user installed the dataset.
Variables: return the info of each variable in the selected installed dataset.
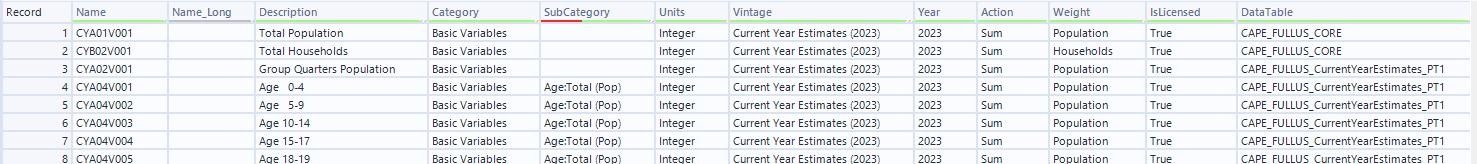
From the result table in Fig. 3 above, many column names have the code. This option helps to decode the info about Description, Category, Sub-Category, Units, ...
I use the Dynamic Rename tool to connect the Allocate Input tool from the left input anchor and the Allocate Metainfo tool on the right input anchor.
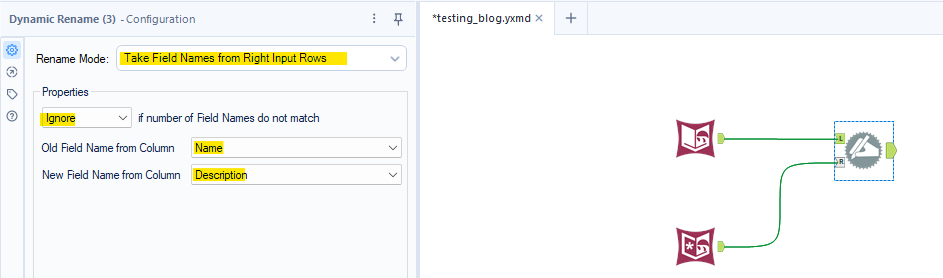
The Dynamic Rename tool will rename the column name from the left input anchor by the new name (Description) on the right input anchor if the column name in the left input anchor matches the column Name in the right input anchor.
Note: The selected dataset in the Allocate Input tool and Allocate Metainfo tool must be the same.
Version: return the Allocate Engine version number.
3/ Allocate Report Tool
The Allocate Report tool will return data from the input anchor, the custom Allocate Report (the format could be a snippet, HTML, PDF, Word, Excel, PowerPoint,...), and the Allocate Report Name.
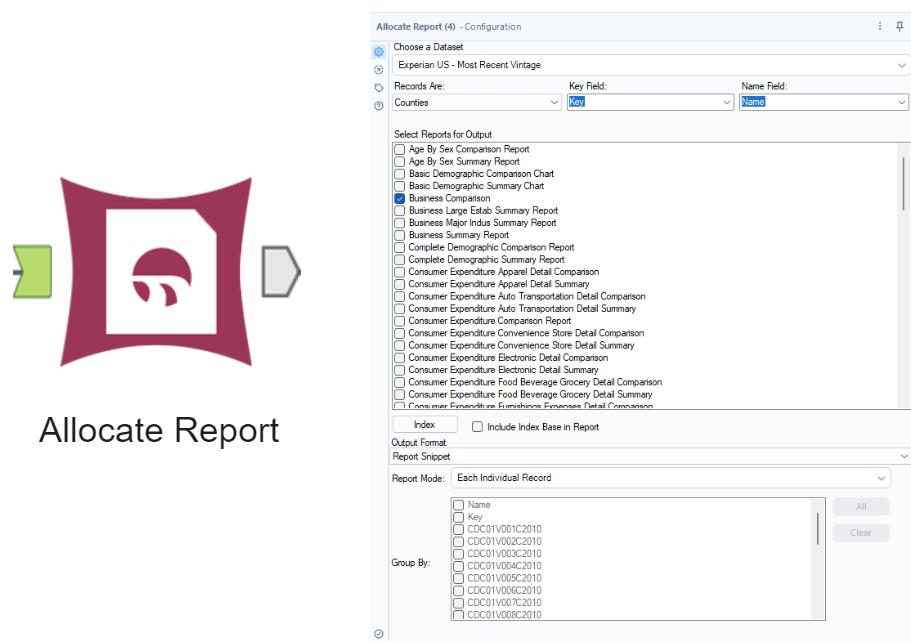
In the Configuration tool, the user can select the installed Allocate Dataset, choose the type of geography record, key field (depending on the record type, it could be Spatial field), and Name field. The user can also select the report output in Select Reports for Output, Report Output Format.
4/ Allocate Append Tool
The Allocate Append tool allows the user to append the demographic data from the installed Allocate Dataset.
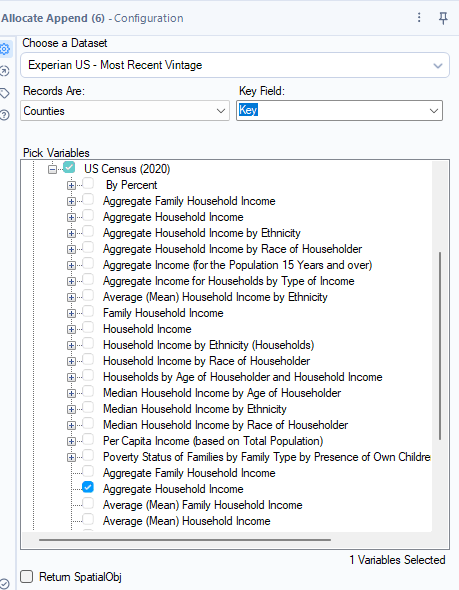
After selecting the dataset, you can choose the option of Geography from the "Records Are:" dropdown menu. For example, I chose Records are Counties with the Key field. I pick one variable to append to my current dataset. In this case, I want to know the Aggregate Household income of each county. I selected the Aggregate Household Income checkbox. If you want to return the Spatial Object, you can also check the box "Return SpatialObj".
The result table will append the new variable to the current dataset at the end.
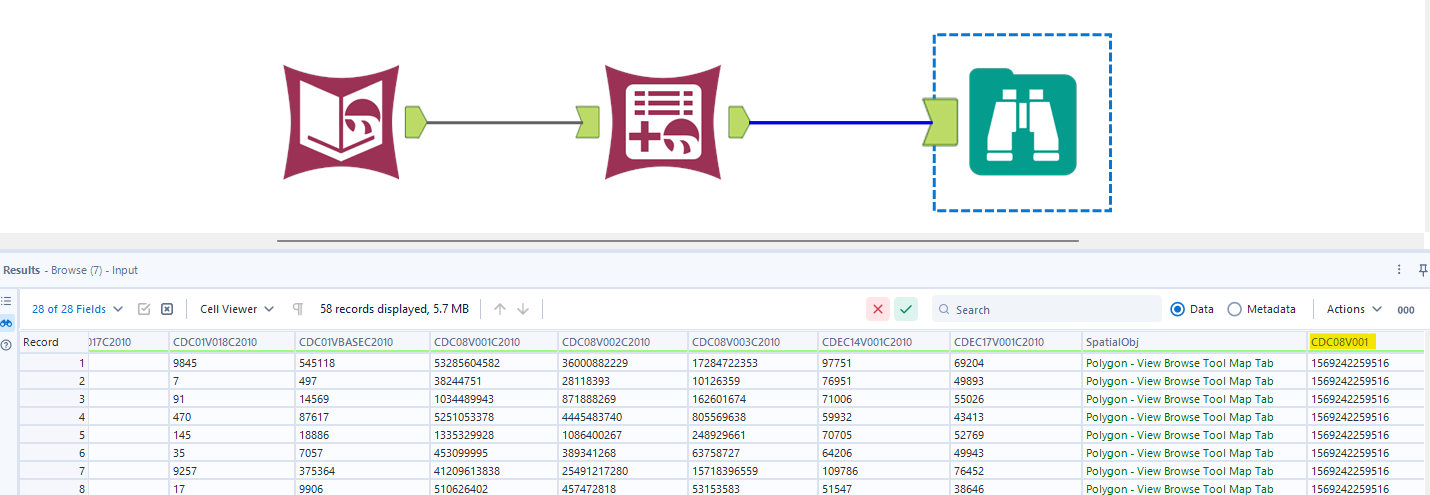
You can add the Allocate Metainfo tool and use the Dynamic Rename tool to rename the column field as I showed in the Allocate Metainfo Tool above.
In this blog, I shared some features of each Demographic tool in Alteryx. Those Demographic tools help retrieve the demographic data without using API or web-scrapping. Not only return the demographic data, but those Demographic tools also return the Spatial Object. It would be helpful when the user wants to get the stats data at a specific place or wants to compare a place with others.
I hope this blog is helpful to you whether you need demographic data to join with your current dataset in Alteryx.