During the training time with DSNY 5, I had an opportunity to work on a client project using Power BI. The team and I didn't know much about the Power BI tool at that time. Thanks to Lyon Abido, and Kinley Ly - The Data School consultants in cohort DSNY 3, they supported us in that project. One of the struggles that our team faced was the calculation. In Tableau, we usually use the calculated field to write the calculation or apply LODs (Level of Details), and Table Calculations to compute the values. However, in Power BI, we learned another way to compute the values using DAX to write calculations.
In this blog, I will discuss the difference in writing calculations between Power BI and Tableau.
1/ What is DAX in Power BI?
2/ Introduce some common functions and syntax in DAX
- Aggregation functions
- Date and Time functions
- Filter functions (mostly used)
- Logical functions
- Text functions
3/ Comparing DAX in Power BI and LODs in Tableau
Now, are you ready to explore those topics with me? Let's get started!
1/ What is DAX in Power BI?
DAX stands for Data Analysis Expressions. According to the Microsoft page, DAX is a combination of functions, operators, and constants that can be applied in the expressions to calculate and then return one or more values. Users can create a report without using any DAX formulas but for some business problems, users need to use DAX formulas to solve.
2/ Introduce some common functions and syntax in DAX
There are many types of functions in Power BI. They are Aggregation functions, Data Time functions, Filter functions, Financial functions, Logical functions, Text functions, Statistical functions, and more. You can read the documentation here. In this blog, I only introduce some common functions.
Aggregation Functions
Some aggregation functions are the same as Tableau (AVERAGE, COUNT, MIN, MAX, SUM). Besides that, there are many different functions. For example, Power BI has not only SUM function but also SUMX. So what is the difference between those functions? When to use it? Let's figure out.
First of all, the syntax for the SUM function is SUM(<column_name>). It will summarize all values in the column the user specified.
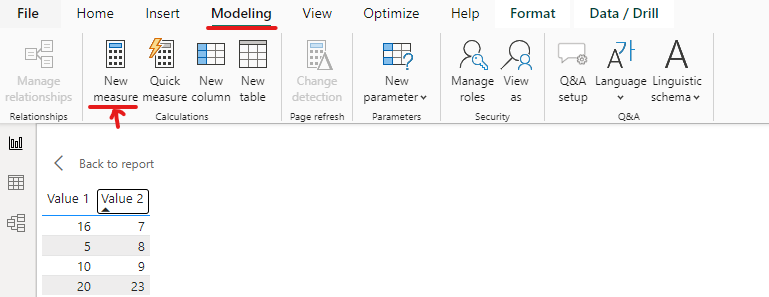
For example: I have a dataset with 2 columns: Value 1 and Value 2 (Image 1).

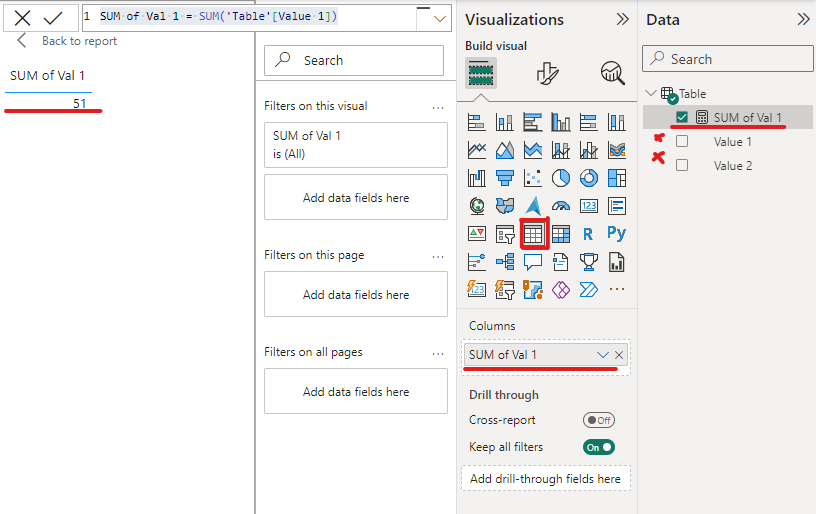
I created a new measure from the Modeling pane. I typed the expression: SUM of Val 1 = SUM('Table'[Value 1]). SUM of Val 1 is the name of the measure and I would like to compute total values in the column Value 1 in the table name Table.

In Image 2, I drag the table tool from the Visualization pane into the canvas. Then, I unchecked Value 1 and Value 2 in the Data pane. I drag the SUM of Val 1 into Columns in the Visualizations Pane. Now, it shows the value 51 in the canvas view.
What happens if I also check Value 1, Value 2, and SUM of Val 1 at the same time?

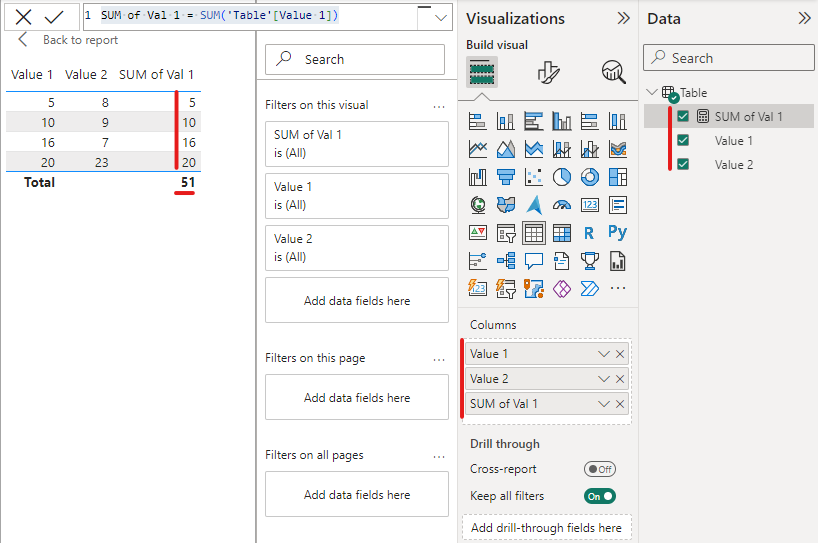
In Image 3, I checked all fields in the Data pane. It will show all fields in the canvas. Do you see something similar? It's the same as the table in Tableau. Now, it will show in the row level. That's why Value 1 = 5, and the SUM of Val 1 is also 5.
Now, I would like to subtract the Value 2 column from the Value 1 column. So, I created a new measure Subtraction = SUM('Table'[Value 1]) - SUM('Table'[Value 2]). Then I checked the box in the Data pane to show.

I got the result I wanted in the Image 4 above.
However, if there are 10 columns Value 1, Value 2, ..., Value 10. Do I need to use the SUM function for each column and subtract as I did in Image 4 or Can I write SUM('Table'[Value 1] - 'Table'[Value 2])?
The answer is No because the SUM function only accepts the column in the parentheses, not an expression. In this case, I will use SUMX.
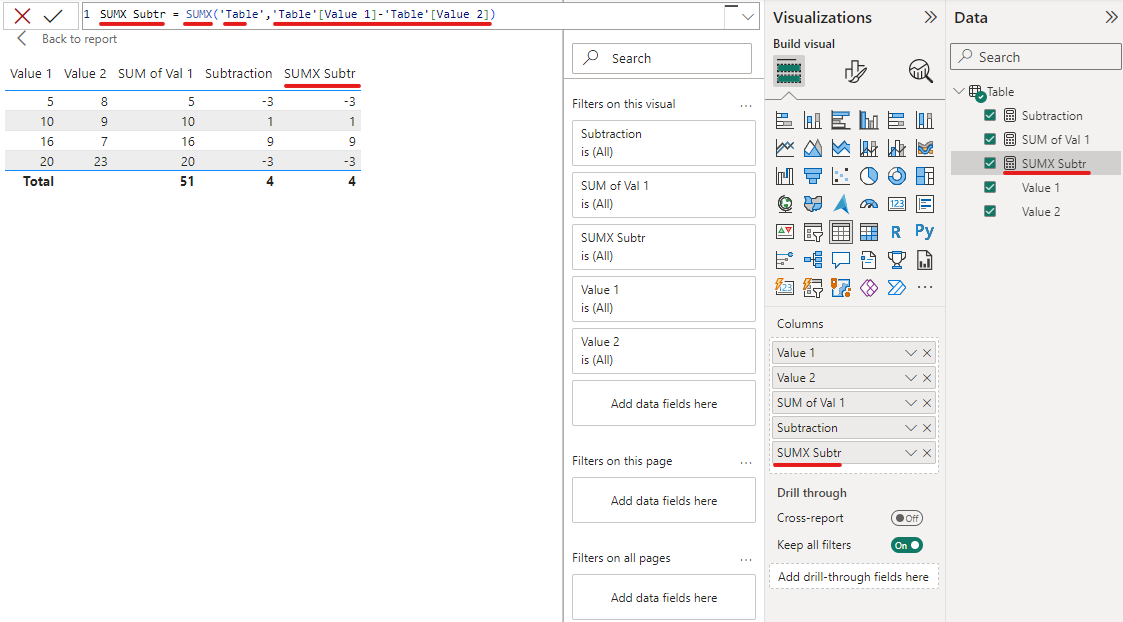
For the SUMX function, the syntax is SUMX(<table>, <expression>) where the table is the table containing the rows in the expressions and the expression to be evaluated for each row in that table.

In Image 5, I created a new measure SUMX Subtr and used the SUMX function to subtract the Value 2 column from the Value 1 column. I also get the same result as the Subtraction measure. However, the expression is shorter.
Some functions have a letter A at the end of the aggregation function. For example, AVERAGE family functions include AVERAGE, AVERAGEX, and AVERAGEA.
The syntax of the AVERAGEA function is AVERAGEA(<column_name>). The syntax is the same as the AVERAGE function. However, there is something different. The AVERAGEA can handle non-numeric data types. According to the documentation page:
- Values that evaluate to TRUE count as 1.
- Values that evaluate to FALSE count as 0 (zero).
- Values that contain non-numeric text count as 0 (zero).
- Empty text ("") counts as 0 (zero).
Date and Time functions
Some date and time functions in Power BI are similar to Tableau. For example DATE, DAY, MONTH, YEAR, QUARTER, TODAY, DATEDIFF, ...
DATEVALUE(date_text): to convert a date in text to the date in datetime format.
EOMONTH(<start_date>,<months>): return the DateTime format of the last day of the month where <start_date> is the start date in datetime format and <months> is the number of months before or after the start date.
For example: EOMONTH("December 19, 2023",2) return 02/29/2024 12:00:00 AM
DATEDIFF(<Date1>,<Date2>,<Interval>): return the number of intervals between 2 dates.
Filter Functions
In Tableau, we usually use LODs with dimension in the calculation when we need to group by a dimension and do aggregation. Power BI also has the same method, but they use Filter functions to list dimensions in the calculation. I will list some filter functions that are mostly used in Power BI.
ALL(<table>): returns all rows in the table or all values in a column and ignores any filters that might have been applied.
ALLCROSSFILTERED(<table>): clear all filters that are applied to a table.
ALLEXCEPT(<table>, <column_name>, ...,<column_name>): remove all context filters in the table except filters that have been applied to the specified columns. It is similar to the FIXED LOD in Tableau when applied to some dimensions in the calculation.
CALCULATE(<expression>, <filter 1>, ..., <filter n>): evaluates an expression in a modified filter context. I will give more examples in the next part.
FILTER(<table>, <filter>): returns a table that represents a subset of another table or expression.
LOOKUPVALUE(<result_columnName>, <search_columnName>, <search_value> [, <search2_columnName>, <search2_value>,...]): returns the value for the row that meets all criteria specified by one or more search conditions.
ORDERBY(<orderby_expression> [, <order> [,<orderby_expression>[, <order>]]..]]): determine the sort order. For example: ORDERBY('Orders'[Sales] ASC)
OFFSET(<delta> [, <relation>][, <orderBy>][, <blanks>][, <partitionBy>][, <matchby>]): return a single row that is positioned before (negative delta value) or after (positive delta value) within the same table.
Logical Functions
The logical function that we usually see is the IF function. Besides that, Power BI also has some logical functions such as AND, OR, NOT, TRUE, FALSE, SWITCH,...
IF(<logical_test>, <value_if_true>, <value_if_false>): check the condition and return the value if the condition is TRUE or FALSE.
SWITCH(<expression>, <value>, <result> [, <value>, <result>] ... [, <else>]): check the expression, if the expression equals the specified value, then return that result. Similar to the CASE in Tableau.
Text Functions
The text function is useful for editing the text or checking the text string. Some common text functions such as LEFT, RIGHT, MID, LEN, TRIM, UPPER, LOWER, VALUE,...
VALUE(<text>): convert a string number into a number. For example: VALUE("3") returns value 3.
FIXED(<number>, <decimals>, <no_commas>): rounds a number to the specified number of decimals and returns the result as a text. <decimal> is optional. If <no_commas> is 1, do not display commas in the returned text; 0 to display commas.
REPLACE(<old_text>, <start_num>, <num_chars>, <new_text>): replaces part of a text string with a different text string based on the number of characters the user specified. For example: REPLACE('Table'[CustomerID], 1, 2, "US"). It means to replace the first 2 characters in the CusomterID column with "US".
SUBSTITUTE(<text>, <old_text>, <new_text>, <instance_num>): replaces existing text with new text in a text string. For example: SUBSTITUTE('Table'[CustomerID], "US", "UK") will replace the "US" with the "UK" in the CustomerID column.
The blog is long, so I will split it into 2 parts. In the first part, I introduced what is DAX, and some common DAX functions in Power BI. There are many more DAX functions in Power BI, you can look up the functions here. In the next part, I will compare DAX calculations and LODs in Tableau by showing examples.
Thank you for reading my blog. See you in the next blog!
