


In the first blog of Calculations in Power BI and Tableau, I introduced the definition of the DAX and some common DAX functions in Power BI. If you haven't read it yet, you can click here. Continue to that blog, in this second blog, I am going to compare DAX calculations and LODs/ Table Cals in Tableau through some cases including:
1/ Return total values and percent of total
2/ Return total values group by a dimension
3/ Finding min/max value group by a dimension
4/ New Customer Acquisition (Decide new or existing customers based on the date)
5/ Current Year Sales versus Previous Year Sales
Are you ready to explore the difference in calculations between Power BI and Tableau? If yes, let's start!
1/ Return total values
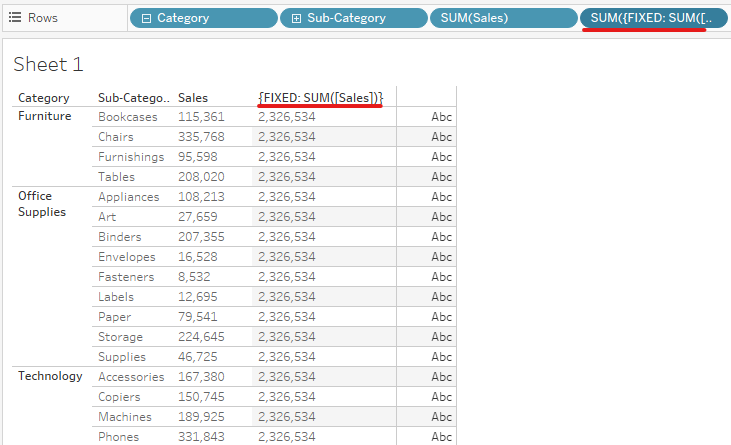
To return the total value of a column, I need to sum all values in the column and return the total value. In some cases, I want to show the total value on each row.
In Tableau, I use the FIXED LOD to get the total values of the sales column. The formula is: {FIXED: SUM([Sales])}. So the total value is 2,326,534 (Image 1).
In Power BI, I use the SUMX function because I need a filter function to let Power BI know that I am calculating the total Sales of all Categories in the table. I cannot use the SUM function because the SUM syntax function only accepts a column.
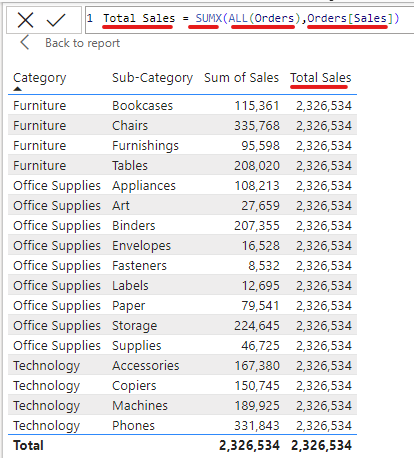
The formula for the Total Sales in Power BI is SUMX(ALL(Orders), Orders[Sales]). The ALL functions will let Power BI accept all values in the column of the Order table. Then, I got the same value as Tableau (Image 2).
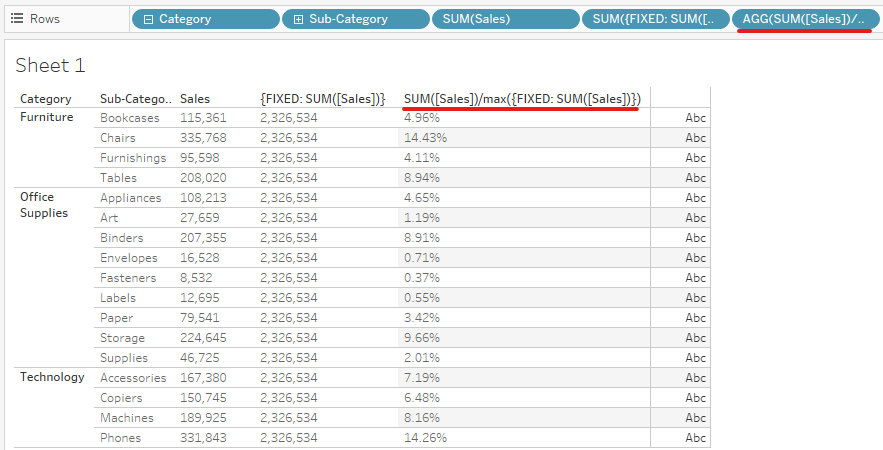
In Tableau, to calculate the percent of the total, I use the formula SUM([Sales])/ MAX({FIXED: SUM([Sales])}). I need to use the Max function outside of the FIXED LOD expression because SUM([Sales]) is an aggregate function. Tableau will announce the error if an aggregation value divides a non-aggregation value. FIXED LOD value cannot be changed, so you can use any functions outside (Image 3).
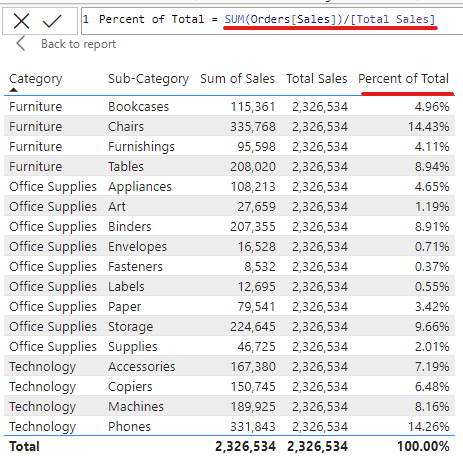
In Power BI, I divide the SUM of sales values by the Total Sales. Then, I get the Percent of Total (Image 4).
2/ Return total values group by a dimension
I want to calculate the total sales of each Category.
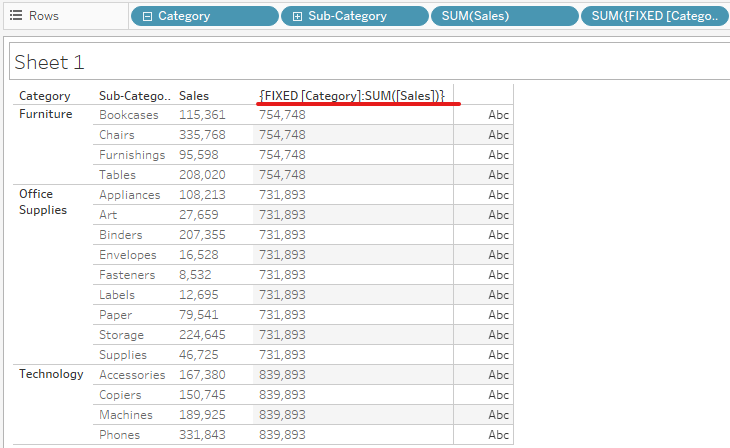
In Tableau, I use FIXED LOD to calculate the Sum of Sales group by each Category. The expression will be {FIXED [Category]: SUM([Sales])} (Image 5).
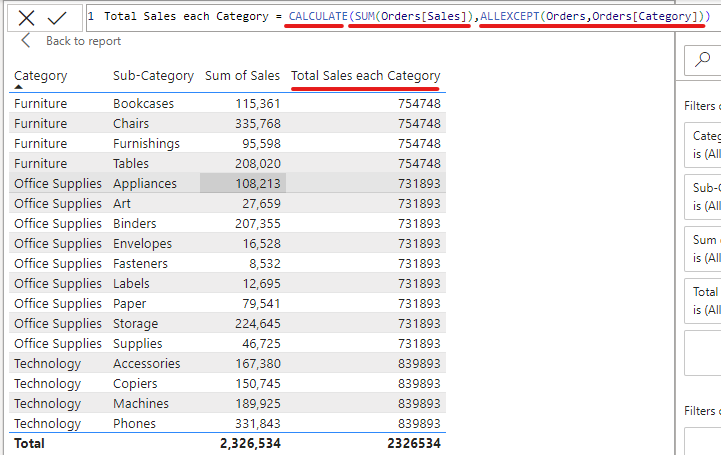
In Power BI, I use the CALCULATE function to calculate the sum of sales with a filter function ALLEXCEPT. I use the filter ALLEXCEPT in this case because that filter will remove all context filters except the filter I specified. In this case, I only want to keep the Category field for the filter. Therefore, the expression for calculating the total sales group by each category in Power BI is CALCULATE(SUM(Orders[Sales]), ALLEXCEPT(Orders, Orders[Category])) (Image 6).
3/ Finding the Max/ Min values group by a dimension
I want to find the Min or Max sales value by each Category.
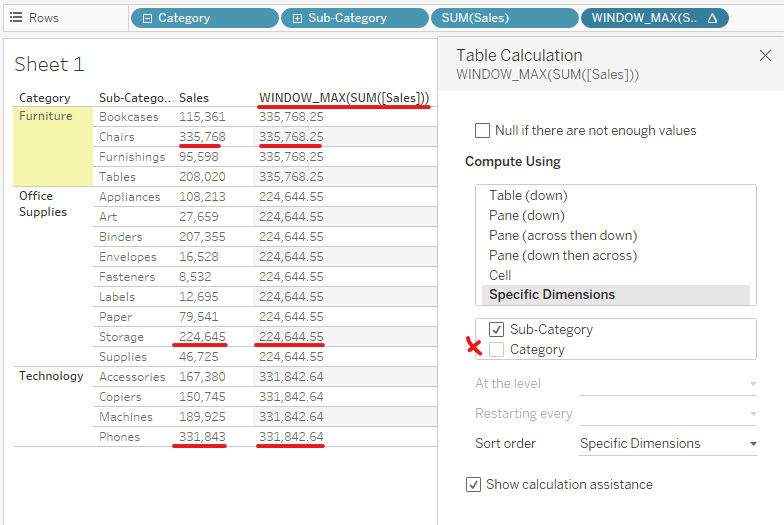
In Tableau, I use the Table Calculation with the WINDOW_MAX function. The expression is WINDOW_MAX(SUM([Sales])).
Then, I right-click on the pill on Rows and choose Edit Table Calculation. I choose Specific Dimensions and uncheck the Category because I would like to group by each Category or find the Max value restart by Category (Image 7).
In Power BI, there is a little bit different from Tableau. To solve that problem, I need a filter and an expression, so I use the CALCULATE function. I am thankful to Nicolas Joseph and Filippo Rossi for helping me in this calculation.
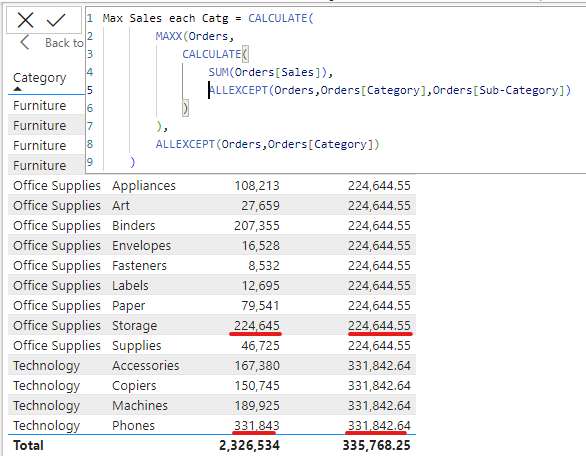
First of all, I need to group by category, so I use ALLEXCEPT(Orders, Orders[Category]) on line 8 (Image 8). Secondly, I need to find the max sum of sales. From line 2, I use the MAXX function for the Orders table. For the expression in the MAXX function, I need to calculate the sum of the sales group by each row level. In this case, I have Category and sub-category levels. Therefore, the nested CALCULATE function is
CALCULATE(
SUM(Orders[Sales]),
ALLEXCEPT(Orders, Orders[Category], Orders[Sub-Category])
)
Then, I got the result in Image 8 same as the result in Tableau (Image 7). You can do the same way for finding the min sum of sales.
4/ New Customer Acquisition
I want to find the date that the customer ordered the first time to decide whether the customer is new or existing.
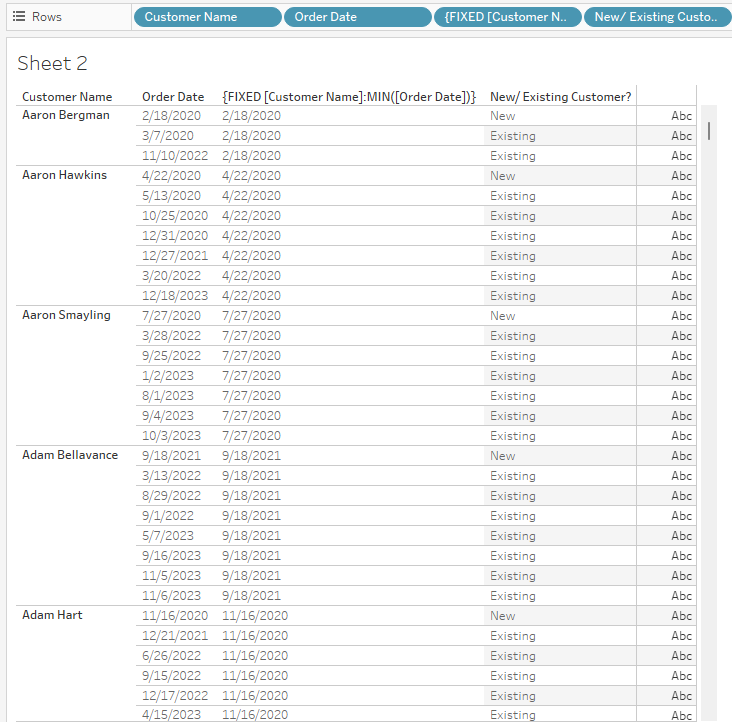
In Tableau, to find the first order date of the customer, I need to use FIXED LOD to find the min order date group by Customer Name. Then, I compare the order date with the min order date. If it's equal, then that is the new customer. If not, that is an existing customer (Image 9).
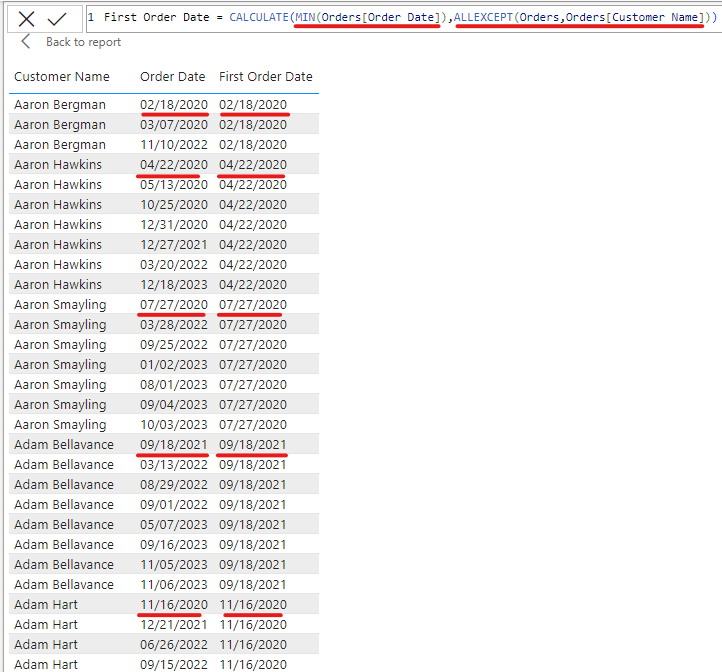
In Power BI, to get the first order date, I use the CALCULATE function to get the min Order Date group by Customer Name. My DAX expression would be CALCULATE(MIN(Orders[Order Date]), ALLEXCEPT(Orders, Orders[Customer Name])) (Image 10).
In the next step, I use the IF function to compare if the Order Date equals the First Order Date, then return "New"; otherwise, returns "Existing" (Image 11).

Note that you need to use the SUM function for the Order Date. Power BI needs an aggregate function for the Order Date.
5/ Current Year Sales and Previous Year Sales
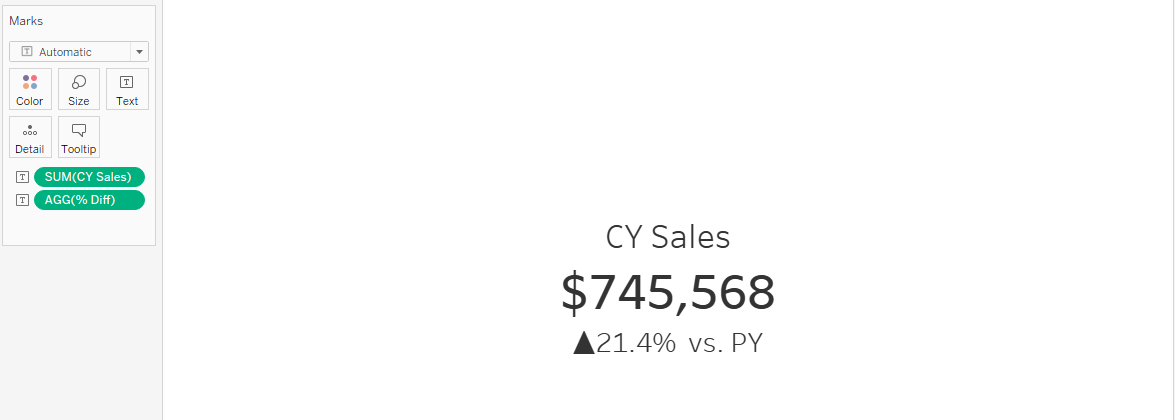
I want to get the KPI as the Image 12. I need to have the sum of sales for the current year, and the sum of sales for the previous year, and then calculate the percentage difference.
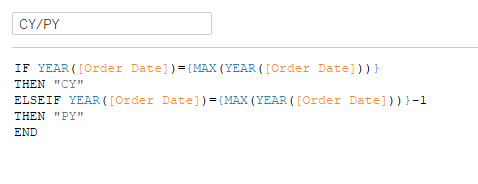
In Tableau, first of all, I need to decide if the year is the current year or the previous year. So, I created a calculated field to check. If the year of the Order Date equals the Max of the order date year in the whole dataset (using FIXED LOD), then return "CY". If the order date year equals the Max of the order date year in the whole dataset - 1, then it's "PY".
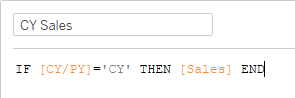
Then I need to get the sum of sales of the CY and PY. In Image 14, if the CY/PY field equals "CY" then return the Sales value. Do the same for the PY Sales value.
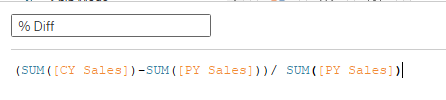
Finally, I can get the percentage difference between the previous year sales and the current year sales (Image 15).
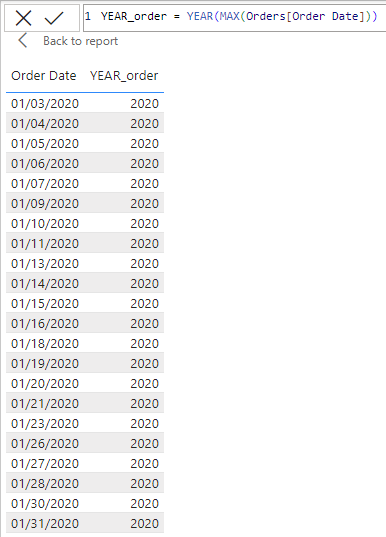
In Power BI, I also follow the same method that I did in Tableau. I get the Year from the Order Date. So I use the Year function. In Power BI, the date needs to be wrapped by an aggregation function. I used the MAX function outside. So the formula should be YEAR(MAX(Orders[Order Date])). (Image 16)
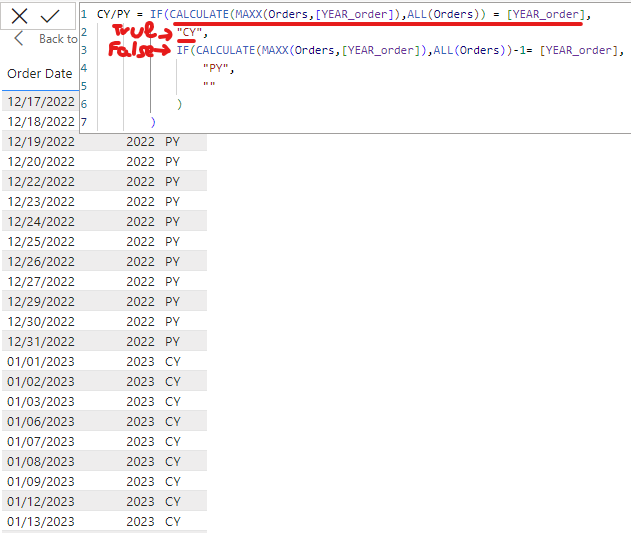
Then, I created another measure called CY/PY. I need to label if the order date year is the current or previous year. I need to use the CALCULATE function because I use the filter ALL for all rows in the Orders table. So if the max of the Year_Order equals the Year_Order, then that's the Current Year (CY). If it's false, check if the Max of the Year_Order -1 equals the Year_Order value. If it's True, then it's the Previous Year (PY); otherwise, it's blank. (Image 17)
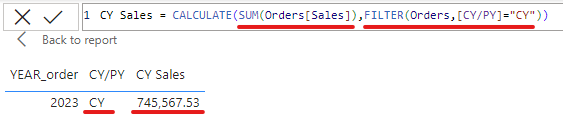
In the next step, I am going to compute the sum of sales for the current year. It has a condition that [CY/PY] equals "CY", so I need to use the CALCULATE function with the FILTER function. My formula for the CY Sales is CALCULATE(SUM(Orders[Sales]), FILTER(Orders, [CY/PY]="CY")). (Image 18)
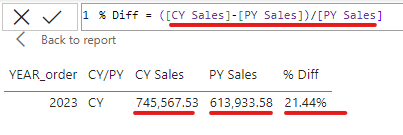
I did the same way for the sum of sales in the previous year, but the filter is "PY". In the final step, I need to calculate the percentage difference between the previous year and the current year. (Image 19)
I got the same result with the result in Tableau.
This blog is long. Thank you so much for reading my blog. I hope these use cases are helpful to you if you are working on Power BI or you are transferring your work from Tableau to Power BI.
LODs in Tableau Part 1: https://thedataschool.co.uk/le-luu/lods-in-tableau-part-1/
LODs in Tableau Part 2: https://thedataschool.co.uk/le-luu/lods-in-tableau-part-2/
Calculations in Power BI and Tableau Part 1: https://thedataschool.co.uk/le-luu/dax-in-power-bi-and-lods-in-tableau/
See you soon in the next blog!