


In Tableau, there are multiple ways to compute the value. Table Calculation and LODs are mostly used in Tableau to compute the data. Each method has its advantages and disadvantages. In the previous blog (Table Calculation in Tableau Part 1), I discussed the Table Calculation definition in Tableau and the dimensions that Tableau uses to calculate the value. If you have not read it, you can read it here. In week 5, my cohort learned more about the LODs and Table Calculation from coach Valerija Kirjackaja.
In this part 2, I am going to discuss how the Table Calculation works with Specific Dimensions in 2 ways: editing in the Table Calculation window and applying Table Calculation in the Calculated Field.
Specific Dimensions in Table Calculation
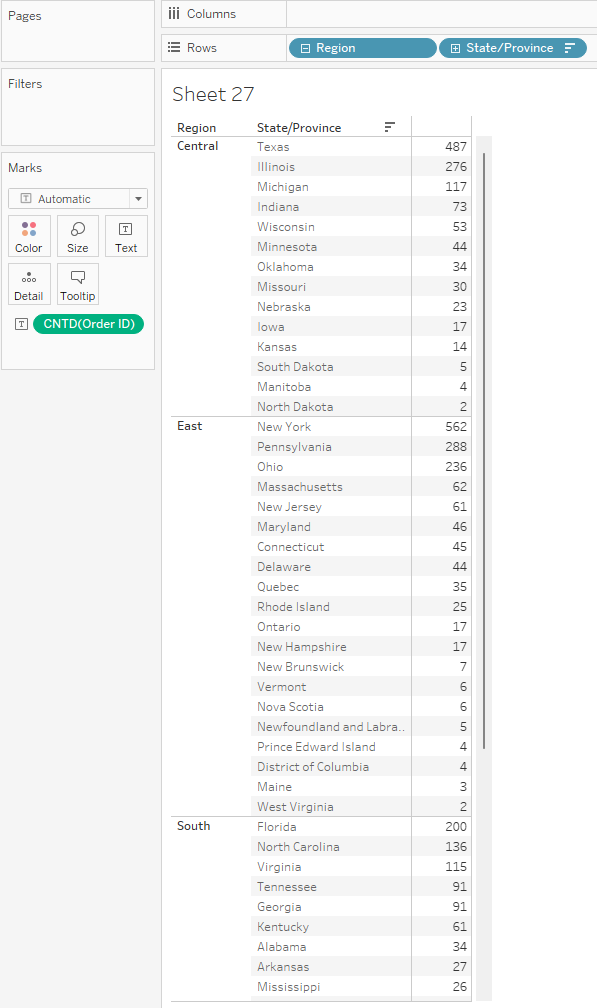
The data source in this blog is from Sample-Superstore in Tableau. Assume that I would like to rank the number of orders from customers in each Region. I will set it up in Tableau and sort the count of orders descending (Image 1):
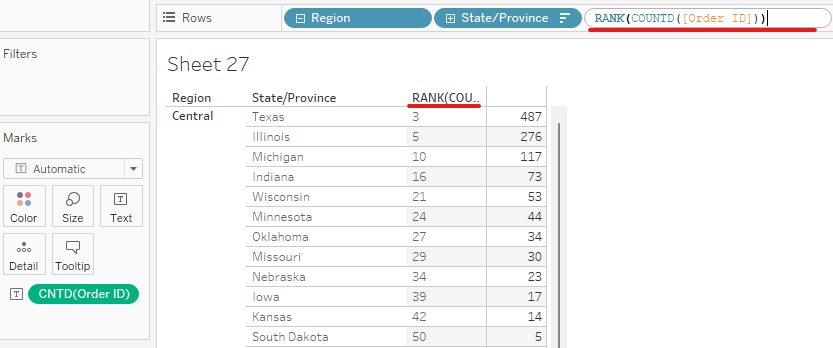
Then, I will put in the Rows as RANK(COUNTD([Order ID])) to compute the rank of the state in each region (Image 2). Then, right-click on that calculation and change it to Discrete. There is a new column for ranking the number of orders. However, the number of ranks is not what I want. Therefore, I need to use the Table Calculation in this case.
I right-click on the calculation again and choose Edit Table Calculation. A window of Table Calculation will pop up (Image 3).
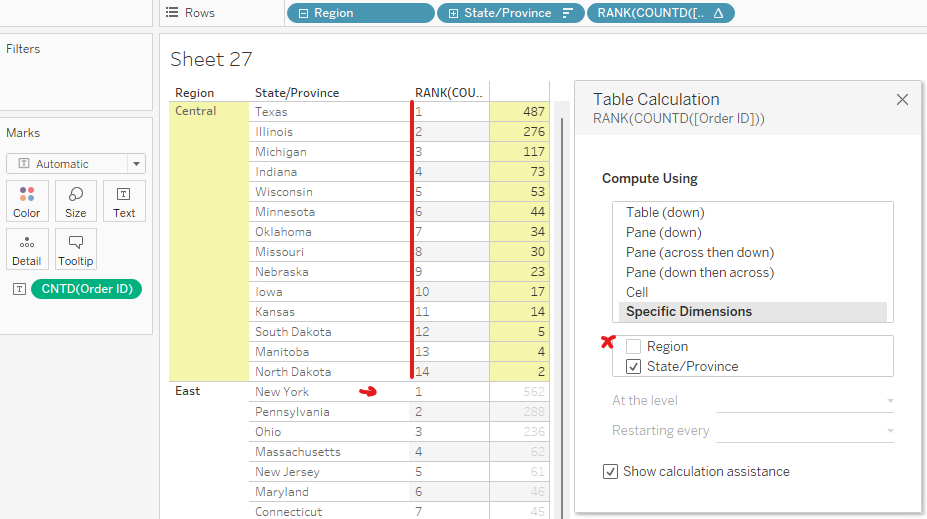
I would like to rank the number of orders from customers by State in each region. Region is higher level than the State/ Province level. In the Specific Dimensions option, I uncheck Region and only keep State/Province. In verbal, I could say: "Calculate the rank of the order number by State/ Province group by Region" or "Ranking the order number by State and restart by region". Now, the result is what I want.
In Table Calculation
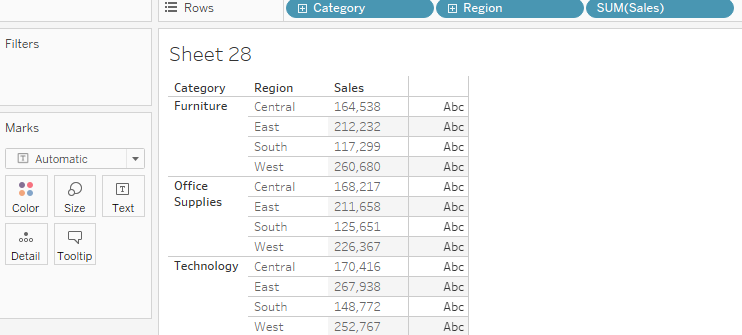
In this example, I create another table by calculating the sum of sales for each category in each region. I drag Category, and Region to Rows and drag Sales to Rows (Change to Discrete) (Image 4).
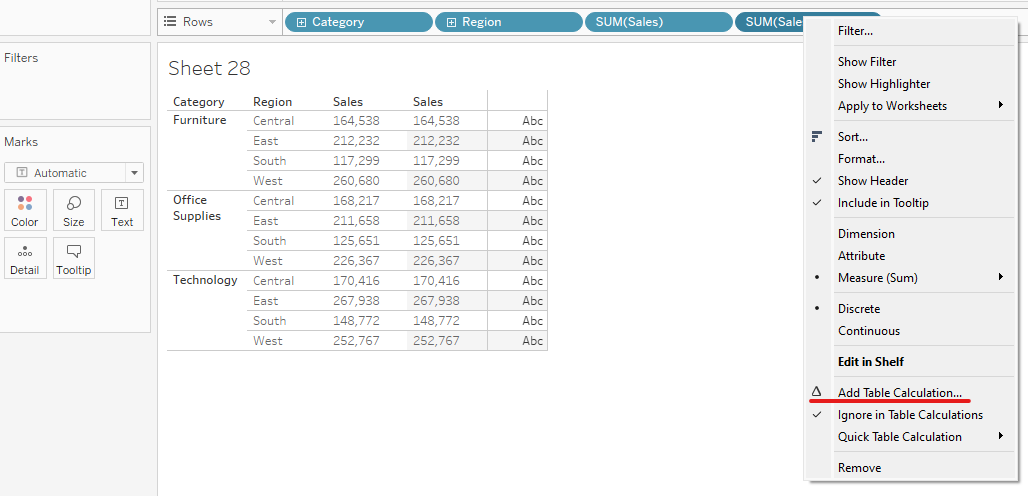
Then, I hold Ctrol and Click on SUM(Sales) to copy it and right-click to choose Add Table Calculation (Image 5).
Then, the Table Calculation table will pop up. There are many types to choose in the Calculation Type (Difference from, Percent Difference From, Running Total, ...). I chose Running Total to summarize the sum of sales in the whole column of Sales. Now, I got the total Sales in the last line which is 2,326,534 (Image 6).
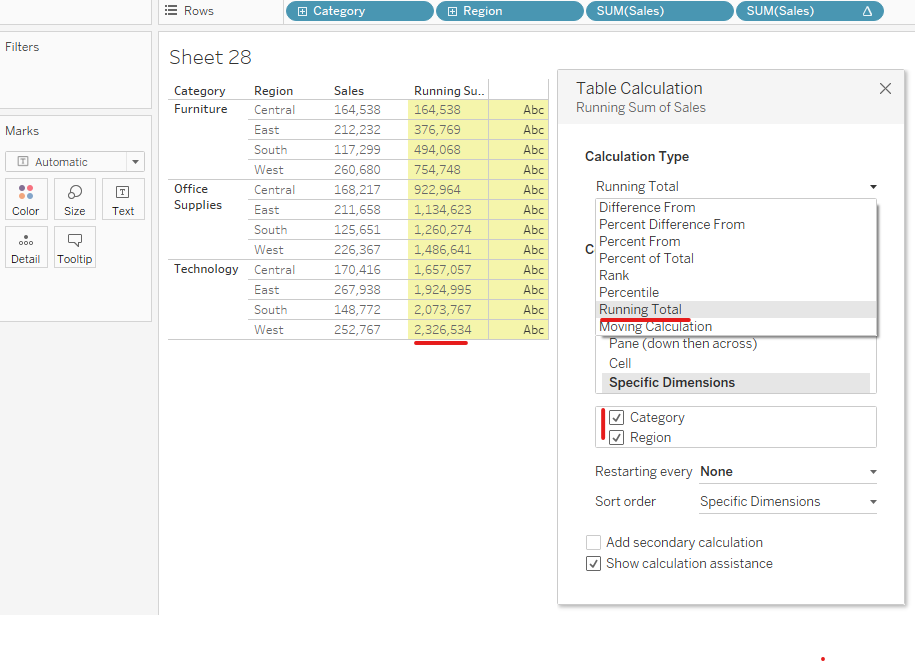
Now, I would like to compare the sale value in each row with the total Sales in the last line (Image 6). It would be helpful if I need to compute the percentage of each row.
In Calculated Field
I created a new Calculated Field with the name Window_Sum_Sales. I type the function WINDOW_SUM(SUM([Sales])) to get the total Sum of sales. Then, I drag the Window_Sum_Sales field into Text in Marks. I got a new column. At this time, every row has the total sum of sales (Image 7).
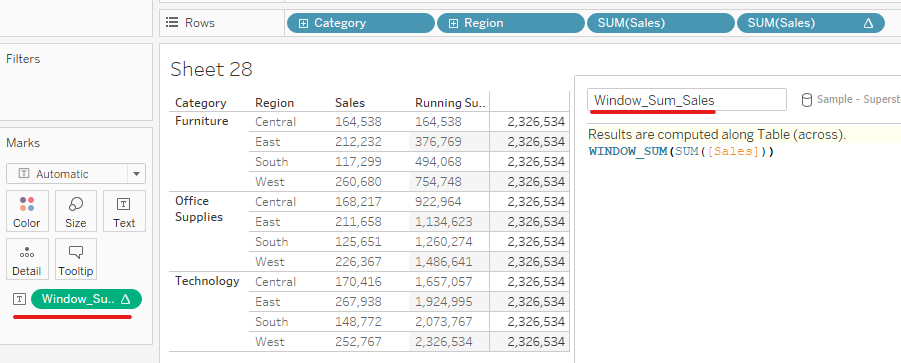
It's very helpful to use this technique to compute the percentage of value in each row with the total.
I hope this blog is helpful to you if you are working with the Table Calculation in Tableau. There are many types of Table Calculation that I don't mention in this blog, but you can research more on the Tableau page here. In the next blog, I will compare LOD and Table Calculation with advantages and disadvantages.
See you in the next blog!