Alteryx is an intuitive, code-free data science software, which comes preinstalled with almost all of the data science tools you would need. However, it has a lot of functions which are not required purely for data preparation. This is where Tableau Prep comes in…
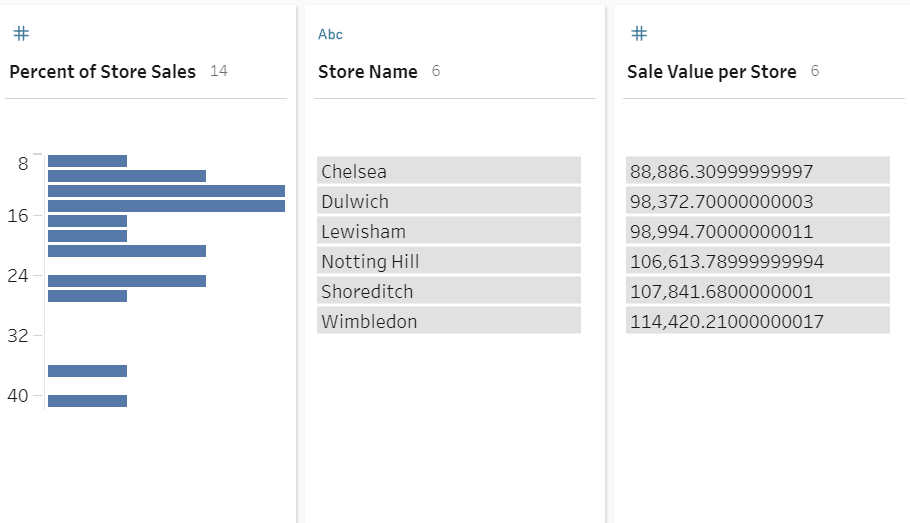
Alteryx excels in many areas, but Tableau Prep’s ability to provide you with a simple way to visualise every column in each part of the process, using bar charts, allows you to not only keep track of your data points, but also see where interesting data points may lie. You may even want to visualise these on your future dashboard.

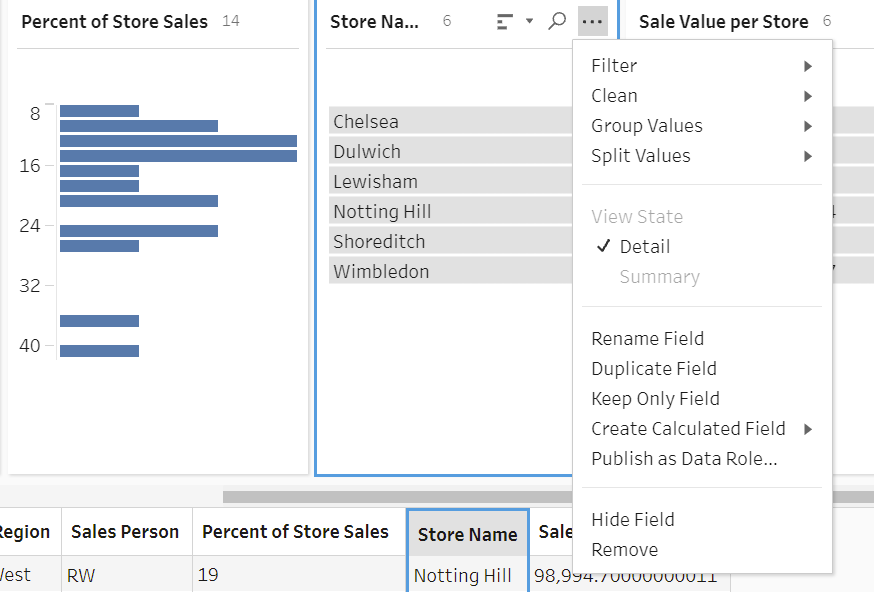
Everything is set out perfectly in front of you, and you can find what you are looking for by simply either left or right clicking on the canvas or on the column headers. There are even functions on Tableau Prep which do not exist in Alteryx, for example, the ability to fix misspelled words, and even tell the program in what way the data points are misspelled (has someone accidentally misclicked while writing or have they written it how they would pronounce it?).

Today is my first day using Tableau Prep, and I can already see how, especially with how easily it integrates with Tableau, it can be very useful for preparing data for visualising in Tableau desktop/public.
