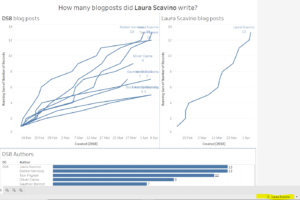
I am going to give a simple explanation on how to create a customised view based on the user, which is looking at the Dashboard. I am using one of the two methods to do that, you can find the second method on Robbin Vernooij latest blog post on how to apply user filters using calculated fields, User Filters in Tableau Server – Part 2.
After having connected to a data source click on a new sheet and select on Server -> Create User filter and select the Dimension you want to filter by. I created a user filter view based on Author by Data School cohorts writing on the Data School blog.
When creating an User filter with Sets, you will have the whole list of users and groups to be added as members for the selected view in the filter. On Tableau server I have a list of users grouped already by Data School Cohort and I therefore tick the right boxes for each of them.
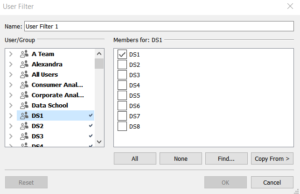
I then drag and drop the User Filter set into the Filters pane and my view will be changing based on the members of each of that group.
I can also create another User filter set with each individual name of DS members and do the same thing for the drag and drop. 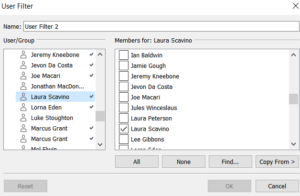
In this way it is also possible to see the users members of each group, which is really helpful to check any missing values.
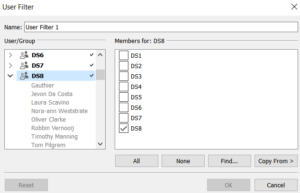
After having built a quick dashboard with 3 separate sheets, I want to check how each user will see it on Tableau Server. I therefore click on the User icon at the bottom right on Tableau Desktop and I can select an Data School cohort or a single name, in order to customise my dashboard.

When I click on Reset, I will automatically go to my view, which in this case is included in the view.
Let’s look at different User views across the Data School. I selected Benedetta Tagliaferri a member of the DS2 group, now part of the core team of The Information Lab. What she will see is either based on the DS2 User filter or her name user filter.
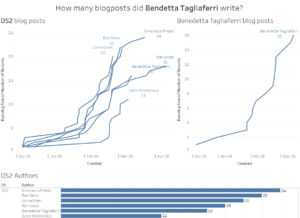
I did the same for all the other members of the Data School, for instance check the user filter view of Giorgia Umani, member of DS7.
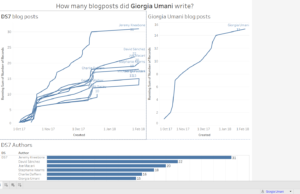
At the bottom right part of the Dashboard you can see the user icon with her name coloured in blue, meaning I am looking at the Dashboard as if I was this specific user.
Either I click on my name or I clear the filter I will either way see the Dashboard in the same way.
