Quick Tableau tip on how to visualise the number of days which are highly profitable, profitable and unprofitable across four different years.
Open the Superstore sample data and follow along with this simple example in Tableau.
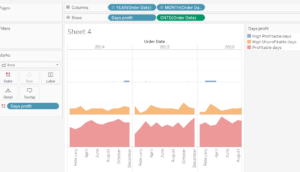
Drag into column the Order Date (dimension, discrete) for Year and click on the plus sign for visualise Month as well. Drag into the row the Order date (measure count distinct, continuous) to know the number of days and also select the show in tooltip option.
Create a calculated field to calculate the different level of profitable days across all years by using a conditional statement within a fixed LOD expression.
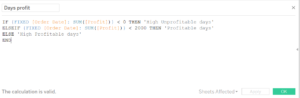
What the conditional statement alone would do is only separating the profit levels takes into account the specific dimensions but with reference to the view level of detail.
The fixed level of detail here compute values using the specified dimension and ignore all the filters in the view other than context filters, data source filters and extract filters.
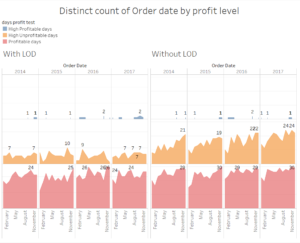
Out of curiosity have a look at the difference between using an LOD calculations and not using it.