Are you a bar chart enthusiastic like me in Tableau? Bar charts are simply the best and simple way to show data in Tableau because they are:
- Easy to understand and interpret
- When sorted in a descending/ascending order it is easy to compare fields
- They are a chart type widely used by anyone across different tools inside or outside Business Intelligence
- The can be coloured, stacked, used with dual axis to compare against another value (i.e. the use of Gantt Bars on top of bar charts for budget against forecast)
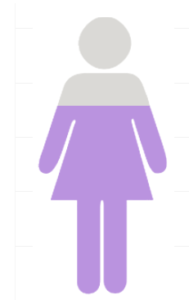
How to create a colourful shape which changes with filters or parameters? This is a very simple idea which I took from a blog post. The idea behind is very simple: just create a bar chart and add a transparent shape on top of it.
This week I had a really interesting project for a client, who asked me a lot about gender distribution and demographics, therefore I thought to use this technique on Tableau.
However sometimes bar charts are not used in Tableau because considered ‘too easy to do’. This is why today I would like to provide a very quick tip on how to use bar charts and make them visually looking good.
First Step
Create a bar chart with just two colours possibly, for better usage in the design. Select a measure and a dimension to visualise and split the view with just two colours. This technique is very good to show percentage of total.
Second Step
Search an image with a transparent centre. The shapes can be found on the internet, depending what kind of shape you are looking for.

Third step
Create a dashboard and insert the shape as an image on the dashboard, float the image. Insert the bar chart field in the dashboard.
Fourth step
Use the shape and precisely cover the bar chart, to cover it completely. This is the result I had with a gender visualisation on Tableau.

As simple as it looks! Hope you can find this useful.
