Server Week
It is Tableau Server week at Data School and the genius, Jonathan MacDonald is here with us all week teaching us the basics. We have covered installs, permissioning, tabadmin command prompts and yesterday we looked at custom Tableau Server admin views.
Custom Tableau Server Admin Views
To build custom admin views connect to the underlying Postgres database where you can find loads of tables to monitor usage and data server stats. You can learn more about how to create them here.
Concurrent Users
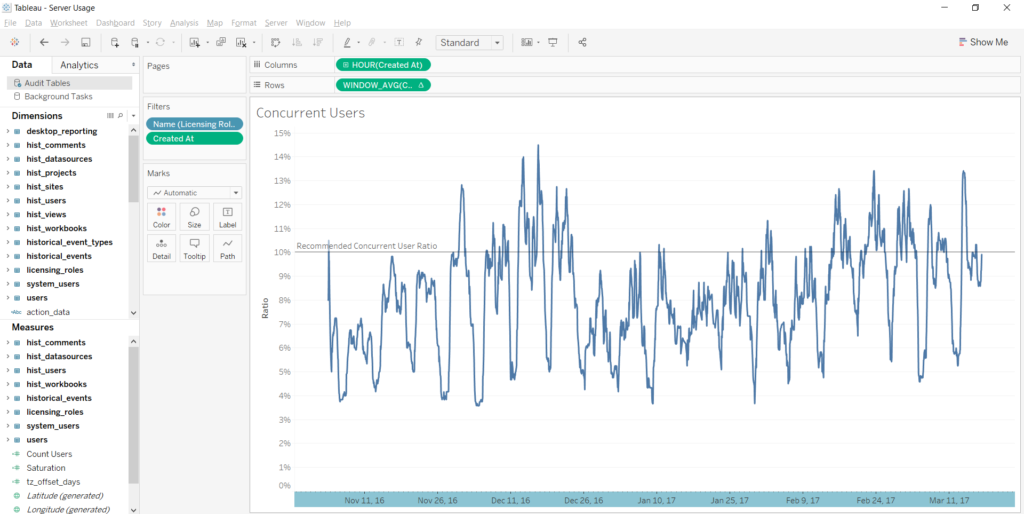
My assignment yesterday was to create a custom admin view looking at concurrent users, in other words, find the total number people using the server at any given time. I wanted to not only look at the number of users on the server but the ratio of concurrent users to the total number of server users. Tableau recommends a concurrent user ratio of 10%.
Table Joins
To do this, I created the following joins (note- there are a lot of additional joins shown below. I am only going to talk about the ones necessary to create the concurrent users):
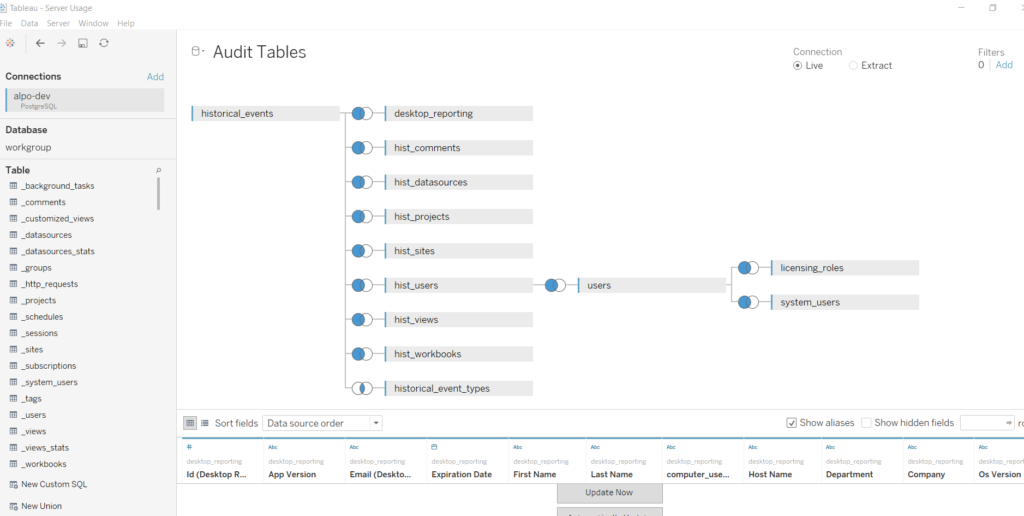
First, I created a left join between the historical_events table and the hist_users table. I joined the fields [Hist Actor User Id] and [Id (Hist Users)]. 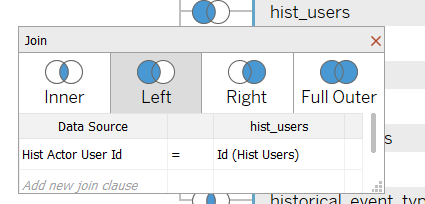
Next, I created a left join between the hist_users table and the users table. I joined the fields [User Id] to [Id (Users)].
Then, I created a left join between the users table and the licensing_roles table. I joined the fields [Licensing Role Id] and [Id (Licensing Roles)].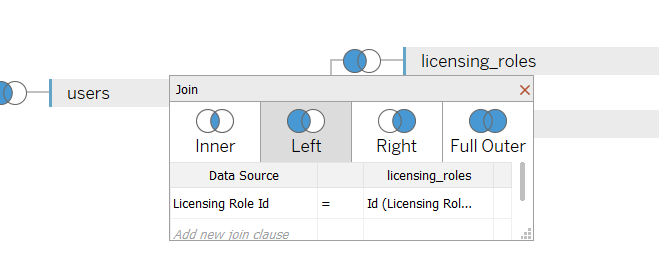
Finally, I created a left join between the users table and the system_users table. I joined the fields [System User Id (Users)] and [Id (System Users)].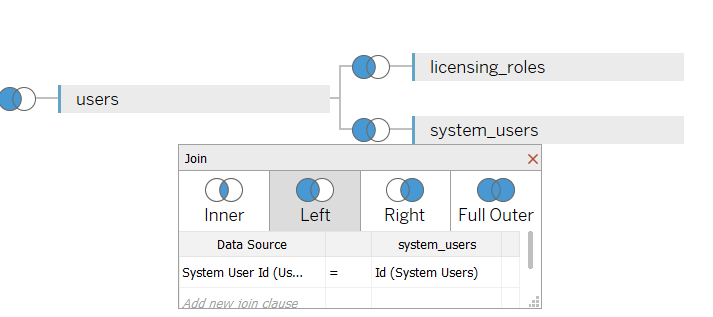
The Visualization
Then I was ready to create my viz. On my worksheet:
- First, I dragged [Created At] from the historical events table into Columns. I changed it from YEAR to HOUR and made it continuous.
- Second, I dragged [Id (System Users)] to Rows, and made the measure CNDT for count distinct. I added a moving average table calculation using the previous 23 values. Now we are looking at moving 24-hour average. Then I turned it into a ratio by dividing by the total number of users, at The Information Lab this is 50, so I double clicked on the pill and typed “/50.”
- Next, I added my filters. The only filter I needed was [Name (Licensing Role)] filtered to Interactor. However, I also added a [Created At] filter because I only wanted to look at the last six months.
- Last but not least, I added a constant reference line at 0.1 or 10%. Now, we can compare our usage with the recommended level.
