New York City has serious rat problem since 1800s and for centuries it is seemingly an unsolved one. It is apparently the home of at least 2 million rats and this problem is still prevalent despite rat-busting and sanitation efforts. According to an article in The Guardian, the city have deployed canine vigilantes as another method of rat control. Lets help them where to look!
This is just one of the many real-case scenarios tools like Alteryx and Tableau can be useful. Coach Andy Kriebel introduced us today to this interesting Spatial feature of these two Softwares. The visualization of rat sightings in NYC Subways within 1 Kilometer radius was approached by using Alteryx first to parse the datasets then visualized them better in Tableau.
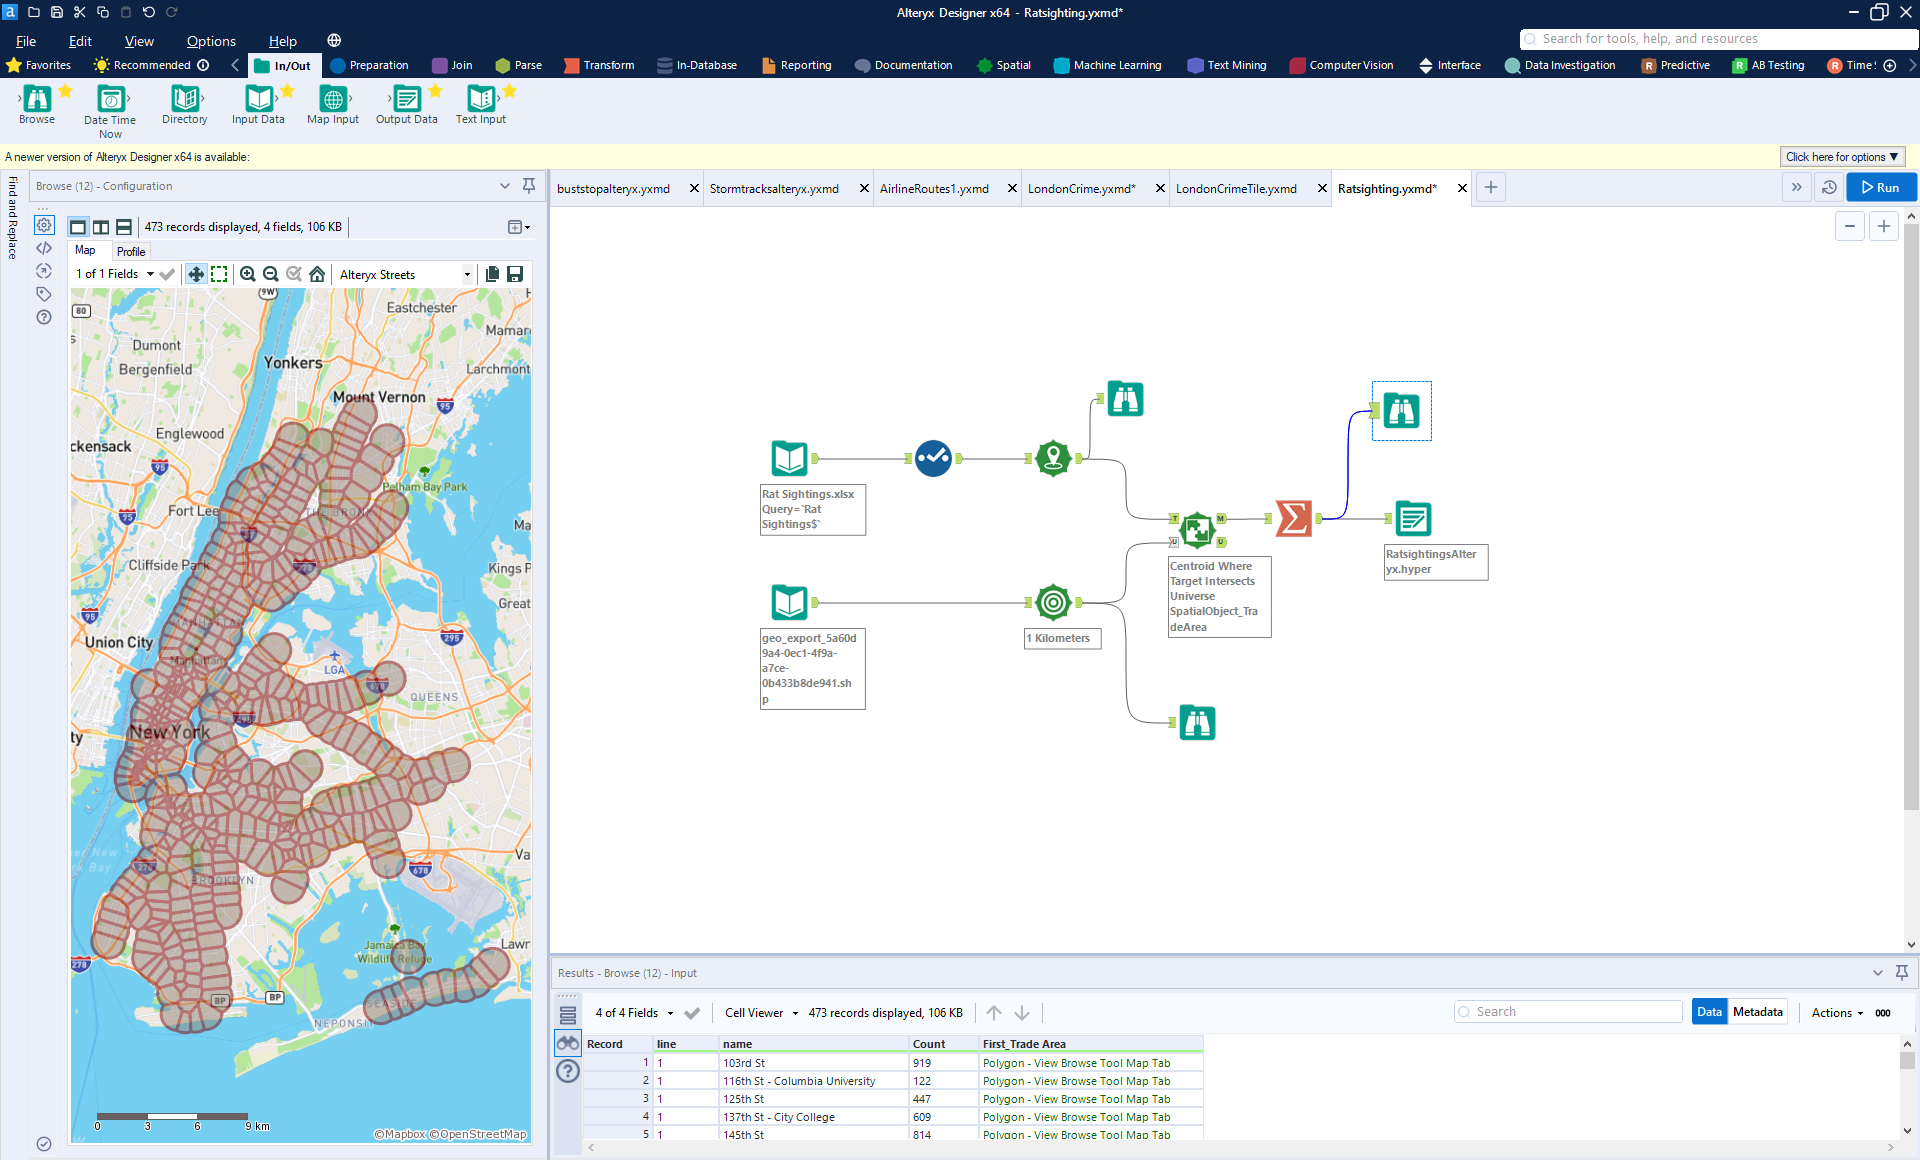
Input datasets are taken from an excel Rat Sightings file and a geo-spatial Shape map of New York Subway stations. And the diagram below shows how each Alteryx tool was configured.
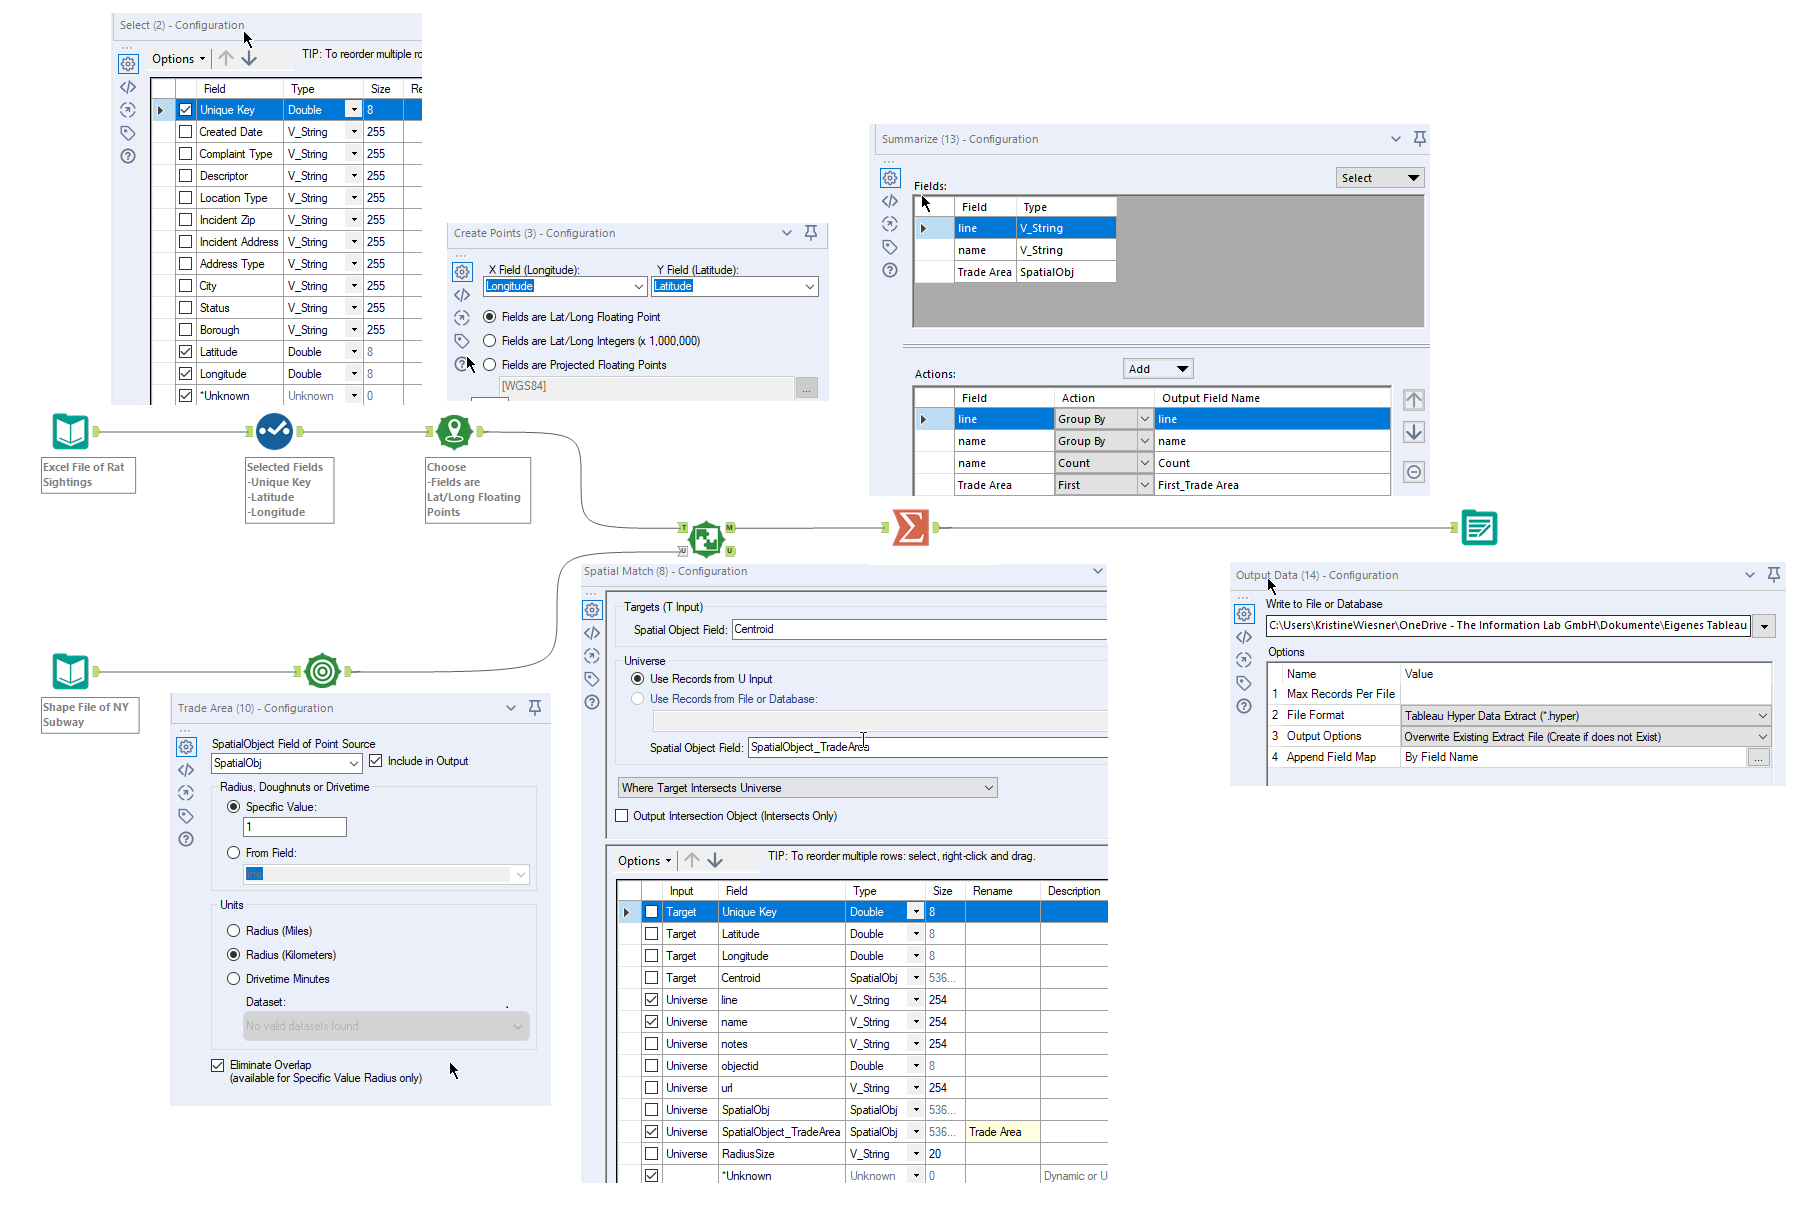
Connecting from the rat sighting file, the Select tool was used to deselect unwanted fields.

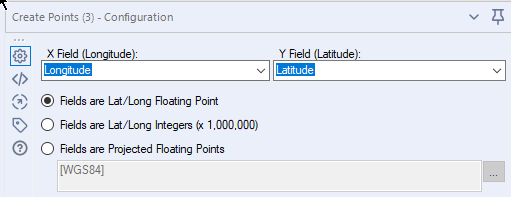
The Create Tool was used to create a spatial object from the coordinates, set the field as floating point.
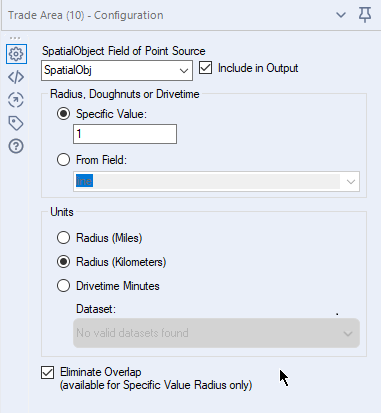
At the other input of geo-spatial data set, a Trade Area tool was used to create region around the Subway and defined the 1-km distance radius.
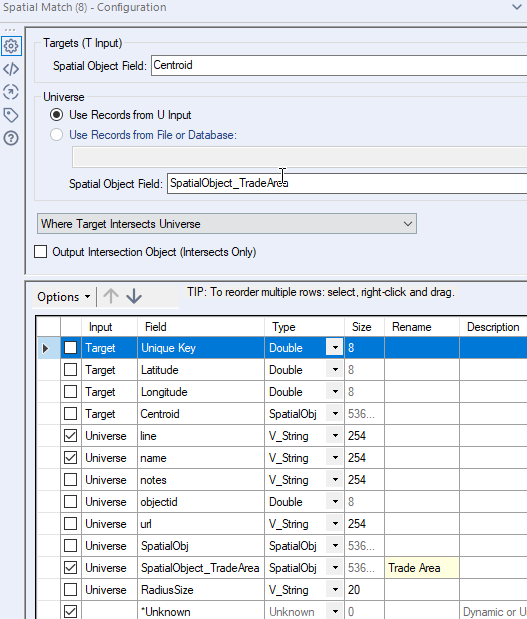
The Spatial Match tool then established the relational intersect of the Target (coordinates) and Universe (centroid). Here we can also select the fields we only need.
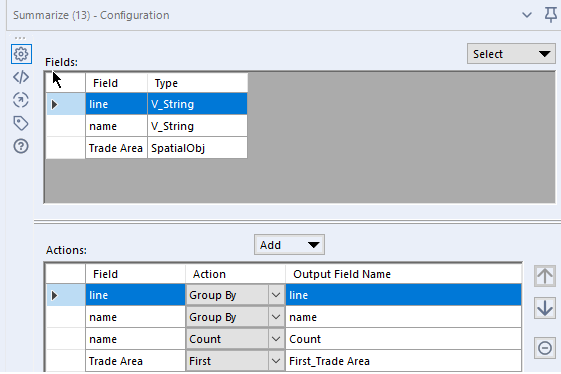
And to consider only one view of each area, a Summarize tool was used to group the Station and Line Names, and the first Spatial object in the trade area.
The output was then saved as a Tableau hyper file, which was set to overwrite existing file every time the workflow is ran.

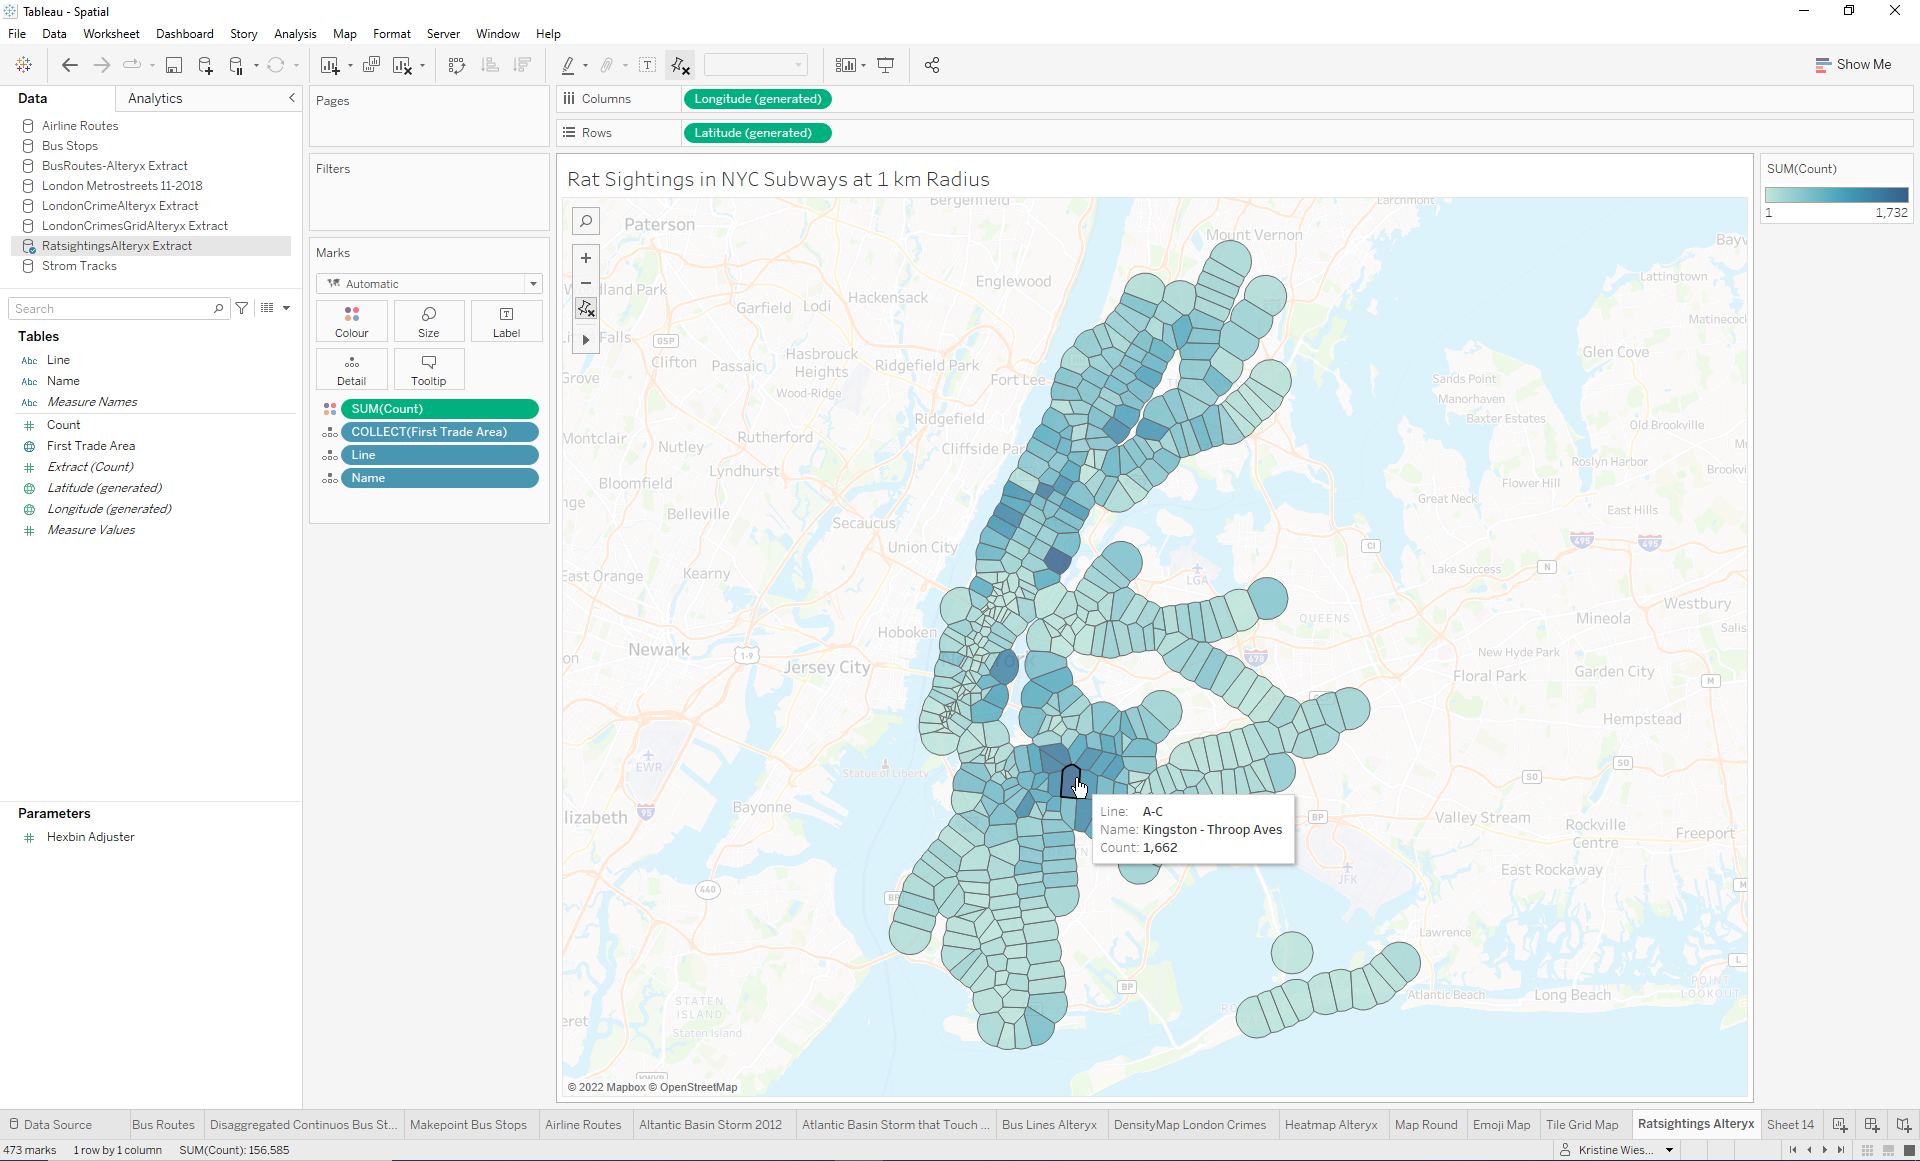
The hyper file was then loaded in Tableau and by dragging First Trade Area to the Details mark, the map was created. To get a colorful visual, Count was dragged in the Color mark, Line and Name were added as detail. And here we can see that the darker the shade, the more rats there are. 🐭🐭🐭
