


Follow these simple steps to show the the top and bottom N values on the same chart (as shown below) using parameter actions!
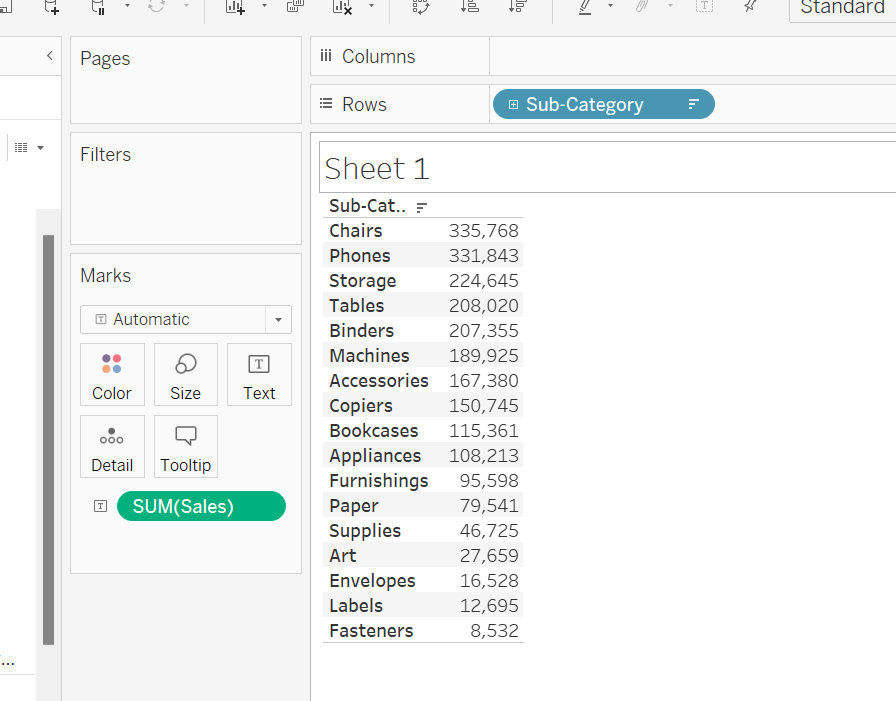
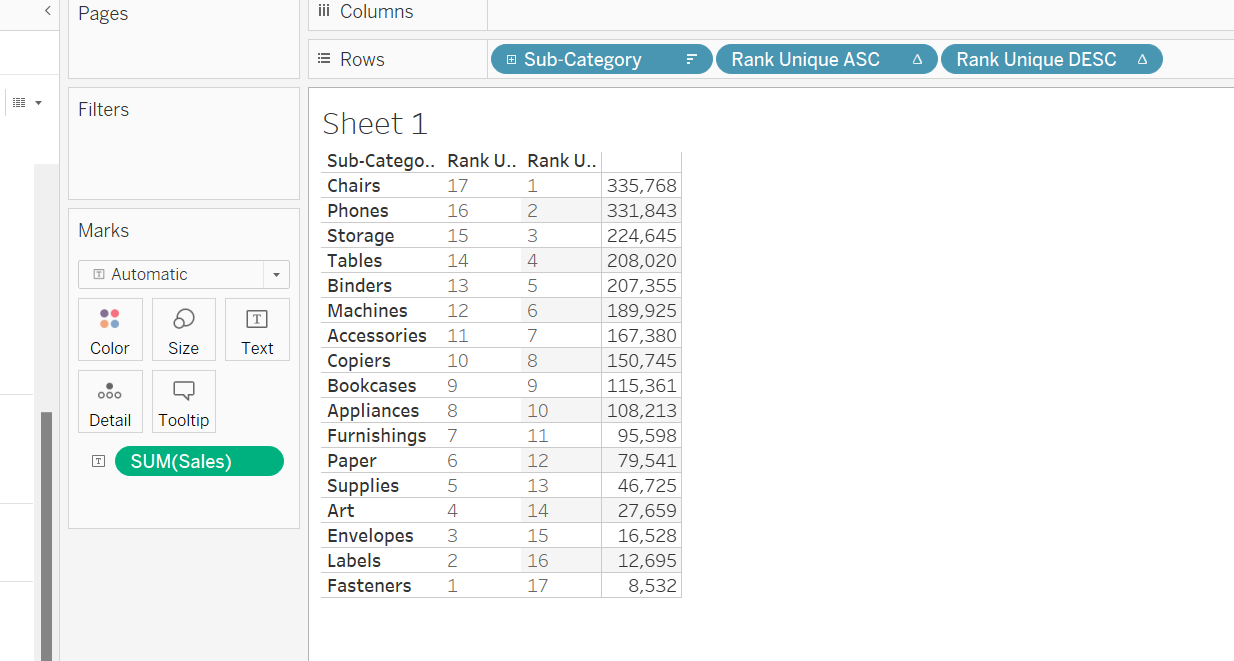
In this example, we are looking at the sales value for each subcategory.
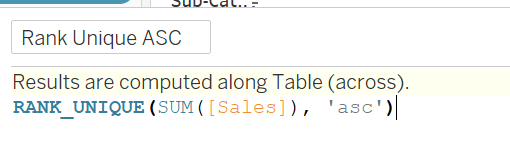
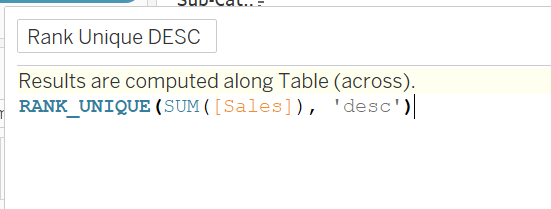
- Create two rank unique calculations; one for the ascending values (top N) and the other for the descending values (bottom N) and name them accordingly. Make sure to use rank unique in case you get the any repeats.
The calculations should look like this:
2. Drag these calculations into the view to see that the calculations are correct.
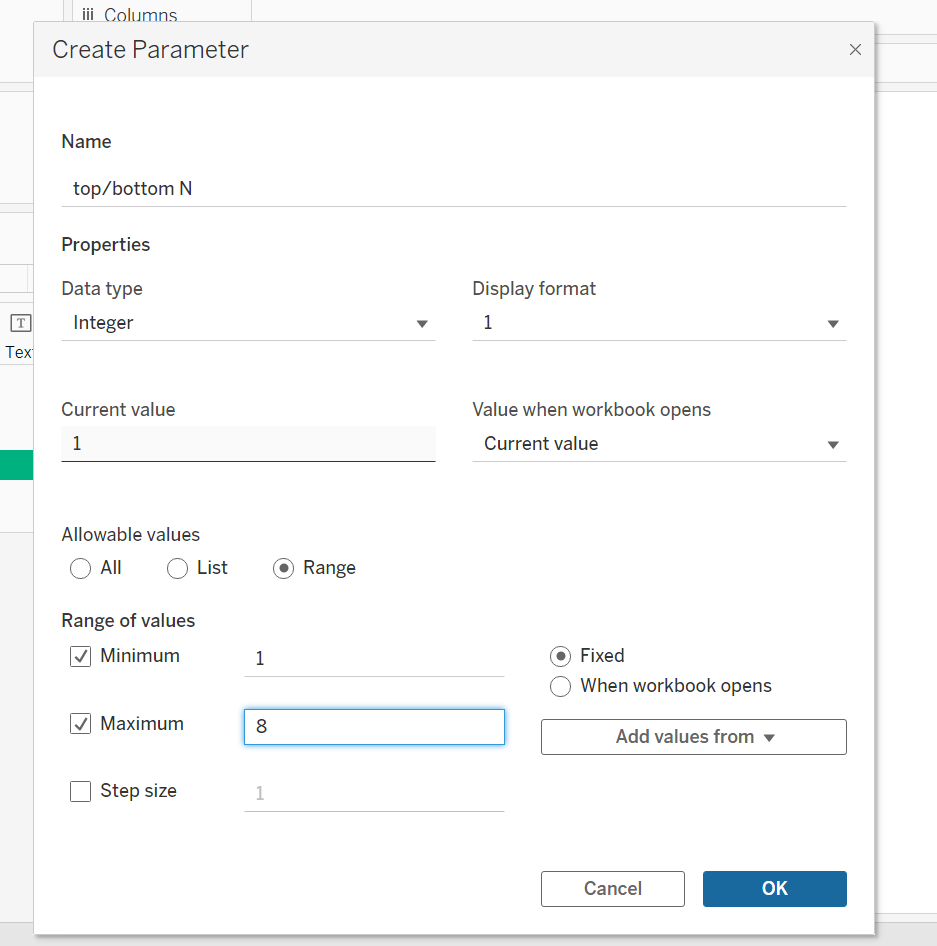
3. Create a parameter to slow you to choose the top/bottom N value as shown below. Here I have used a max of 8 as there are only 16 subcategories. Next, click show parameter.
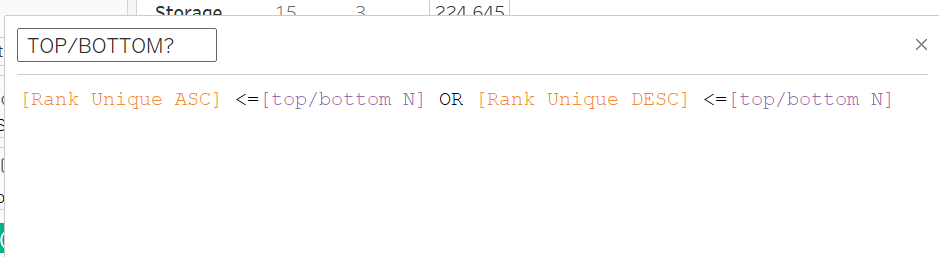
4. Create a calculated field to show only the top/bottom N values.
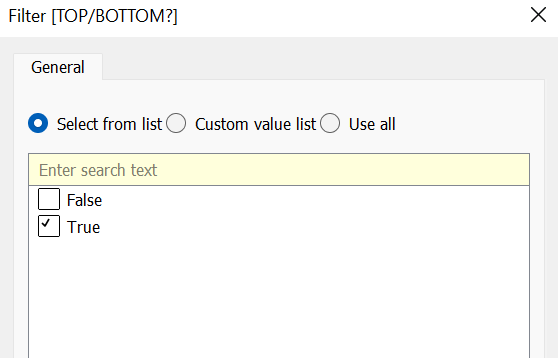
5. Drag this calculated field 'TOP/BOTTOM?' into the filter section and select 'True'. This will only show you the values within the top/bottom N value which will be determined by the parameter.
6. To differentiate between the top and bottom values, create a calculated field naming each one accordingly.
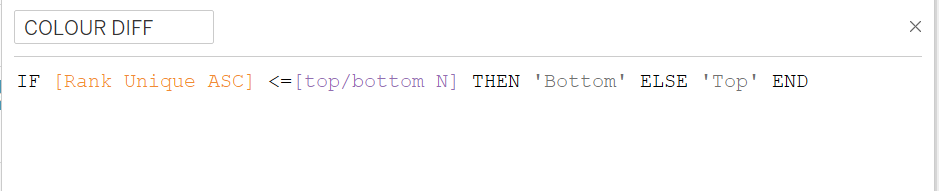
7. Drag the (COLOUR DIFF) calculation onto colour.
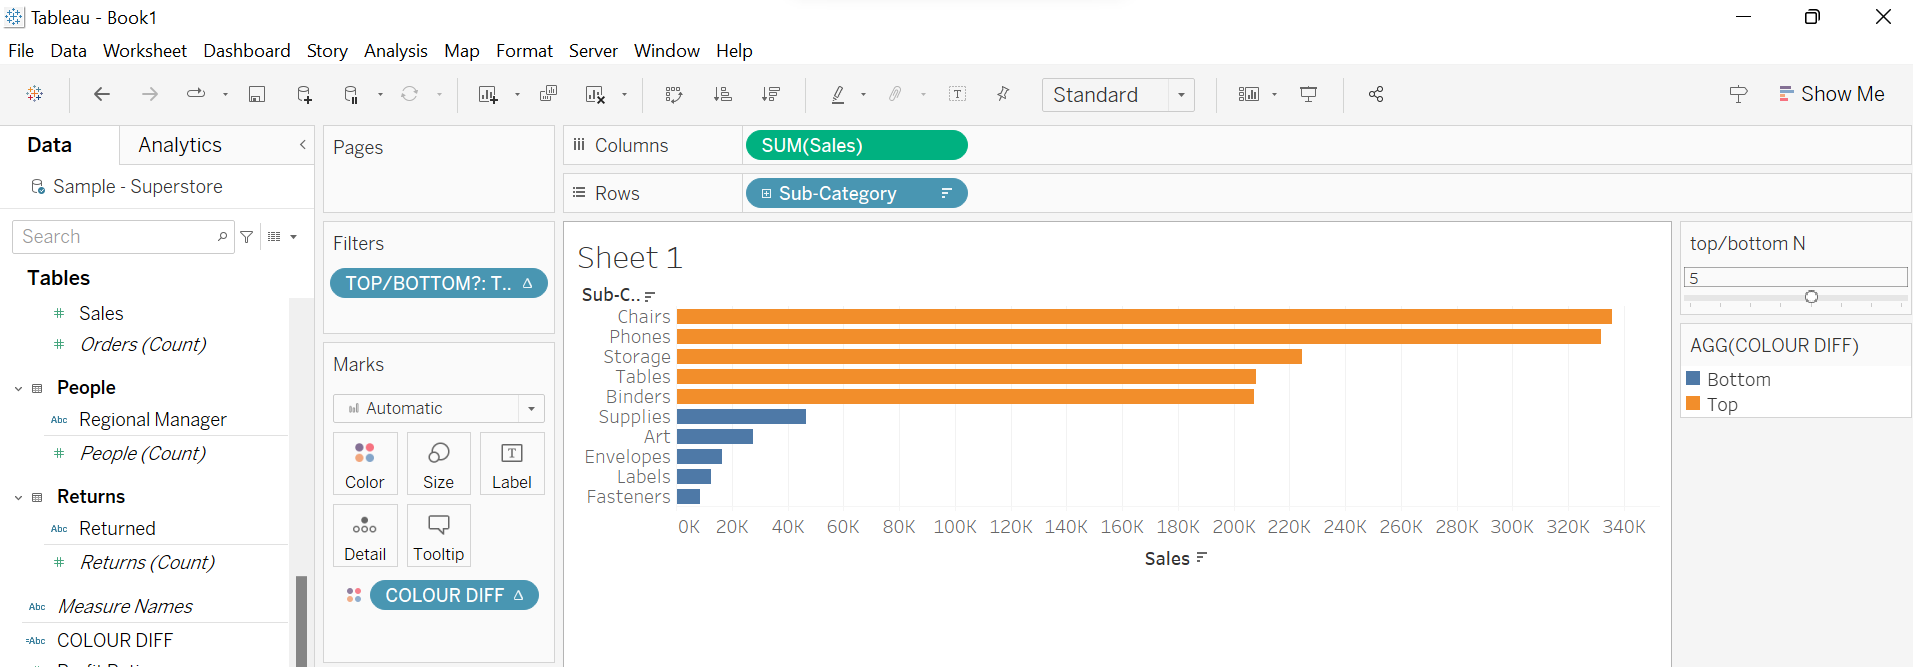
8. Now when you toggle between the values in the parameter you should show the different top and bottom N values!