


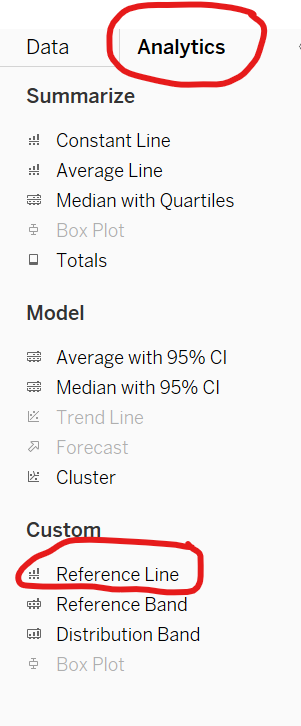
Reference lines are a useful feature which can be used to compare, refer to, or measure against the data values displayed in a graph. Reference lines are often used to show whether data has met a certain target. For example, they are often used to see which product category has exceeded the target sale of x.
When working with a fixed target sale, click on the analytics tab and then reference line and set this to your target value by selecting 'custom value' and adding your target value.
However, if you want to adjust the target value and show a reference line according to each selected target value, a parameter is needed.
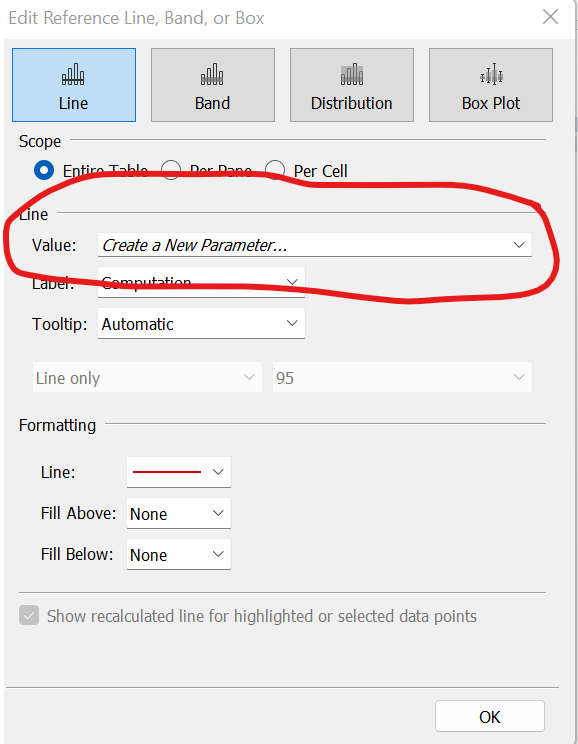
Click create new parameter in the reference line tab. Now you can set your parameter by a list, range or all your values.
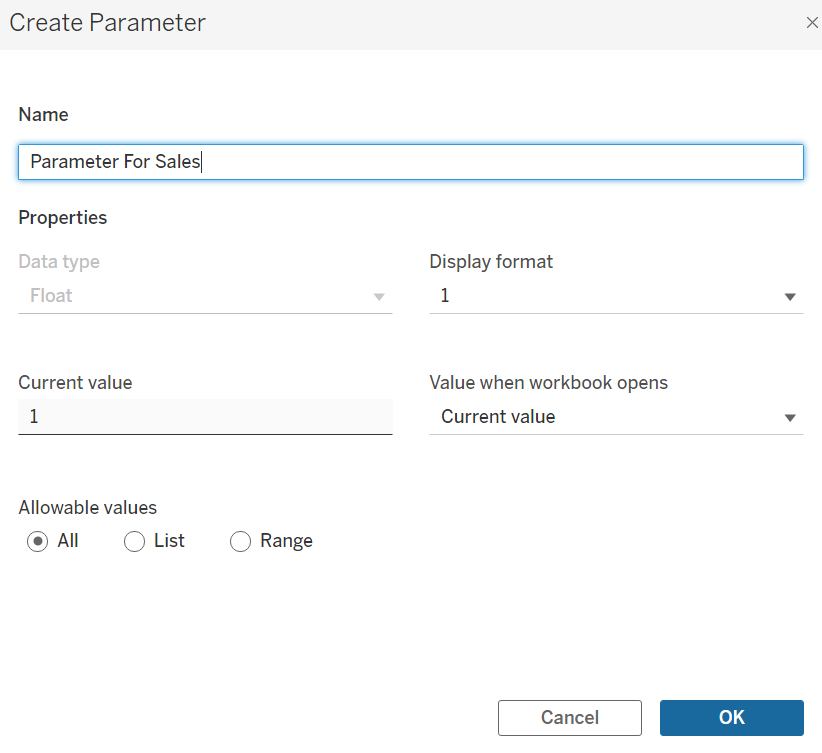
Now you should be able to change the reference line according to the parameter you have set.