


Todays challenge was to download the candy datasets from 2014-2017 and prep and analyze them in the server.
Firstly I imported the data into the server and decided how I would union the tables. This was an issue as the survey data was not consistent across years making it very hard to decide which fields to remove. As I did not want to get rid of too many fields i decided not to include 2014 data into my work and only look at the other years.
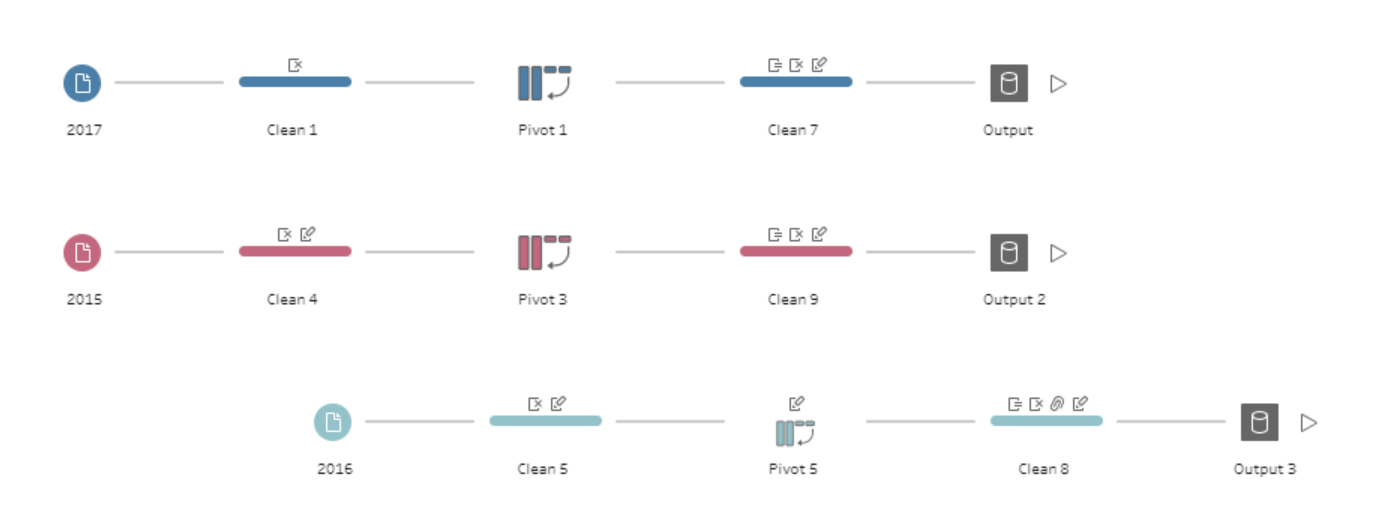
I then cleaned the data and removed fields with nulls and unioned the tables together. I came across a big issue when running my workflow as there was an error when i published the dataset which took me a long time to sort out. The way i went about solving the error was by outputting the individual sheets and for each year which revealed that only 2017 data had an error. I then focused on this table and managed to solve the error.
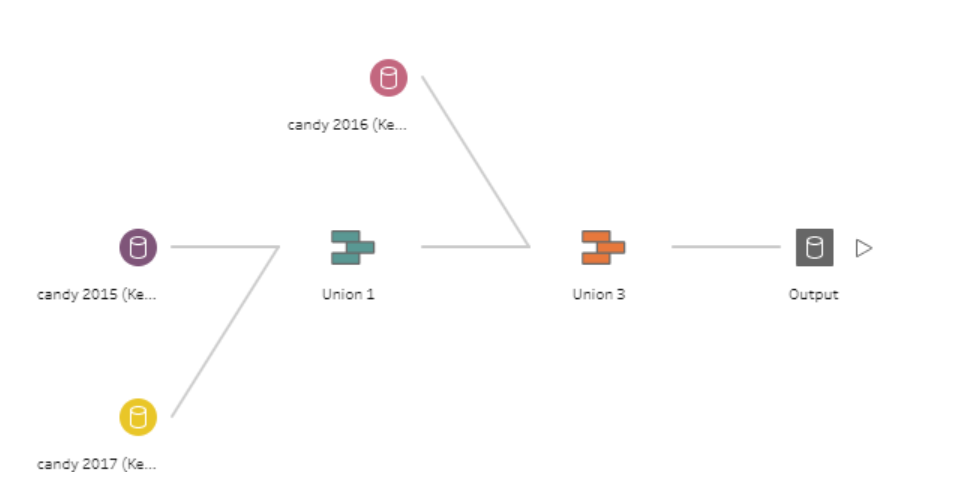
I had to output the individual sheets and then union them in a separate step.
My original plan was to analyze all the unioned data together as well as a separate table with the full 2017 dataset. This would allow me to have a comparison between the years but also get further analysis which was carried out in the 2017 survey alone.
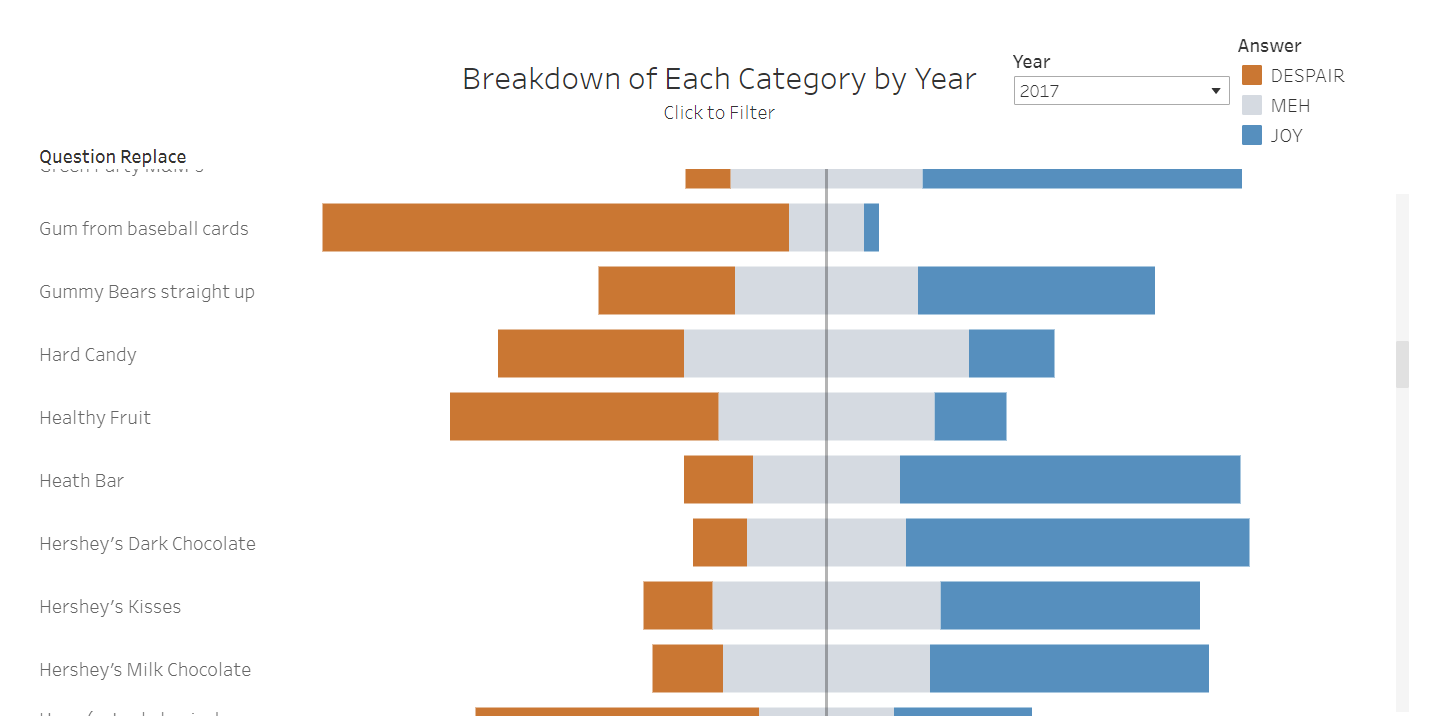
I wanted to be able to compare the results for each of the questions in a Gantt chart. However, this took me a lot longer than I expected due to aggregation issues within my data.
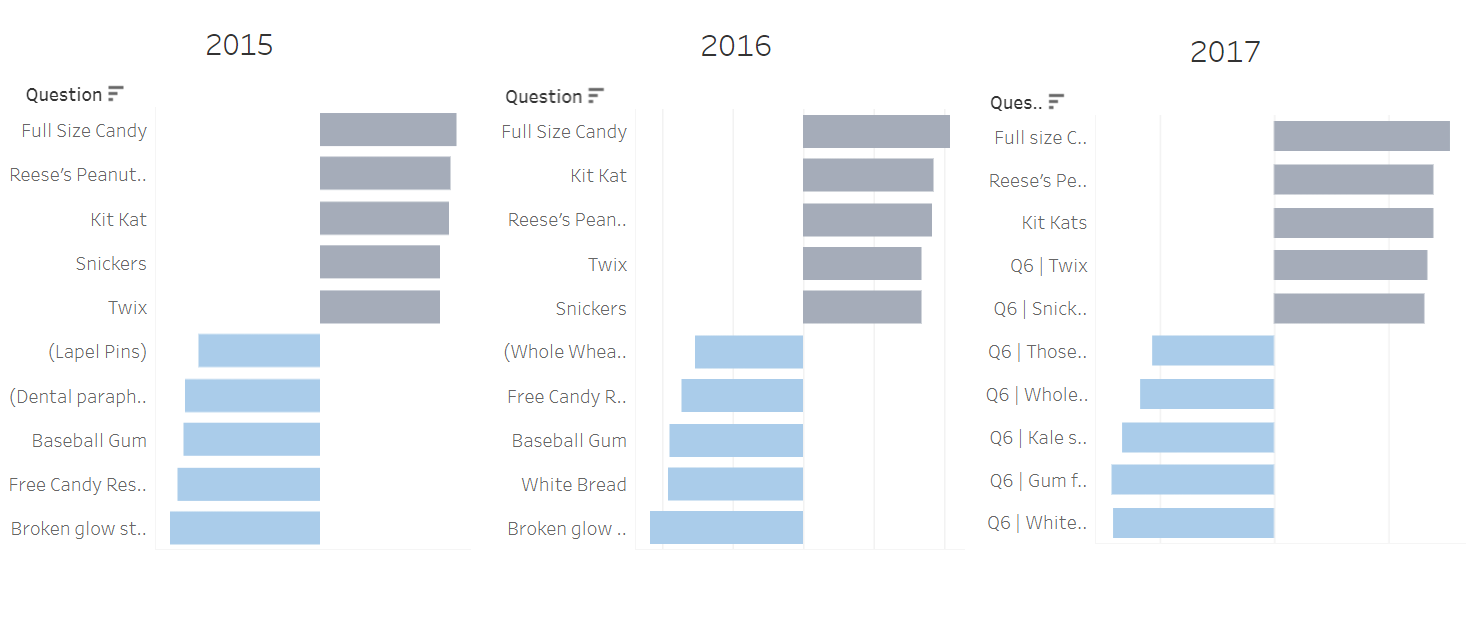
After I Completed this i created 3 bar charts with the top and bottom 5 categories per year.
Finally, I created a line chart for the 2017 data to see if there was a link between age and score.