For today's task, we were each given a dataset and were instructed to create a KPI dashboard using Power BI. After having only a few hours of experience with this software this was a big challenge and would require some time to become familiar with the tool again.
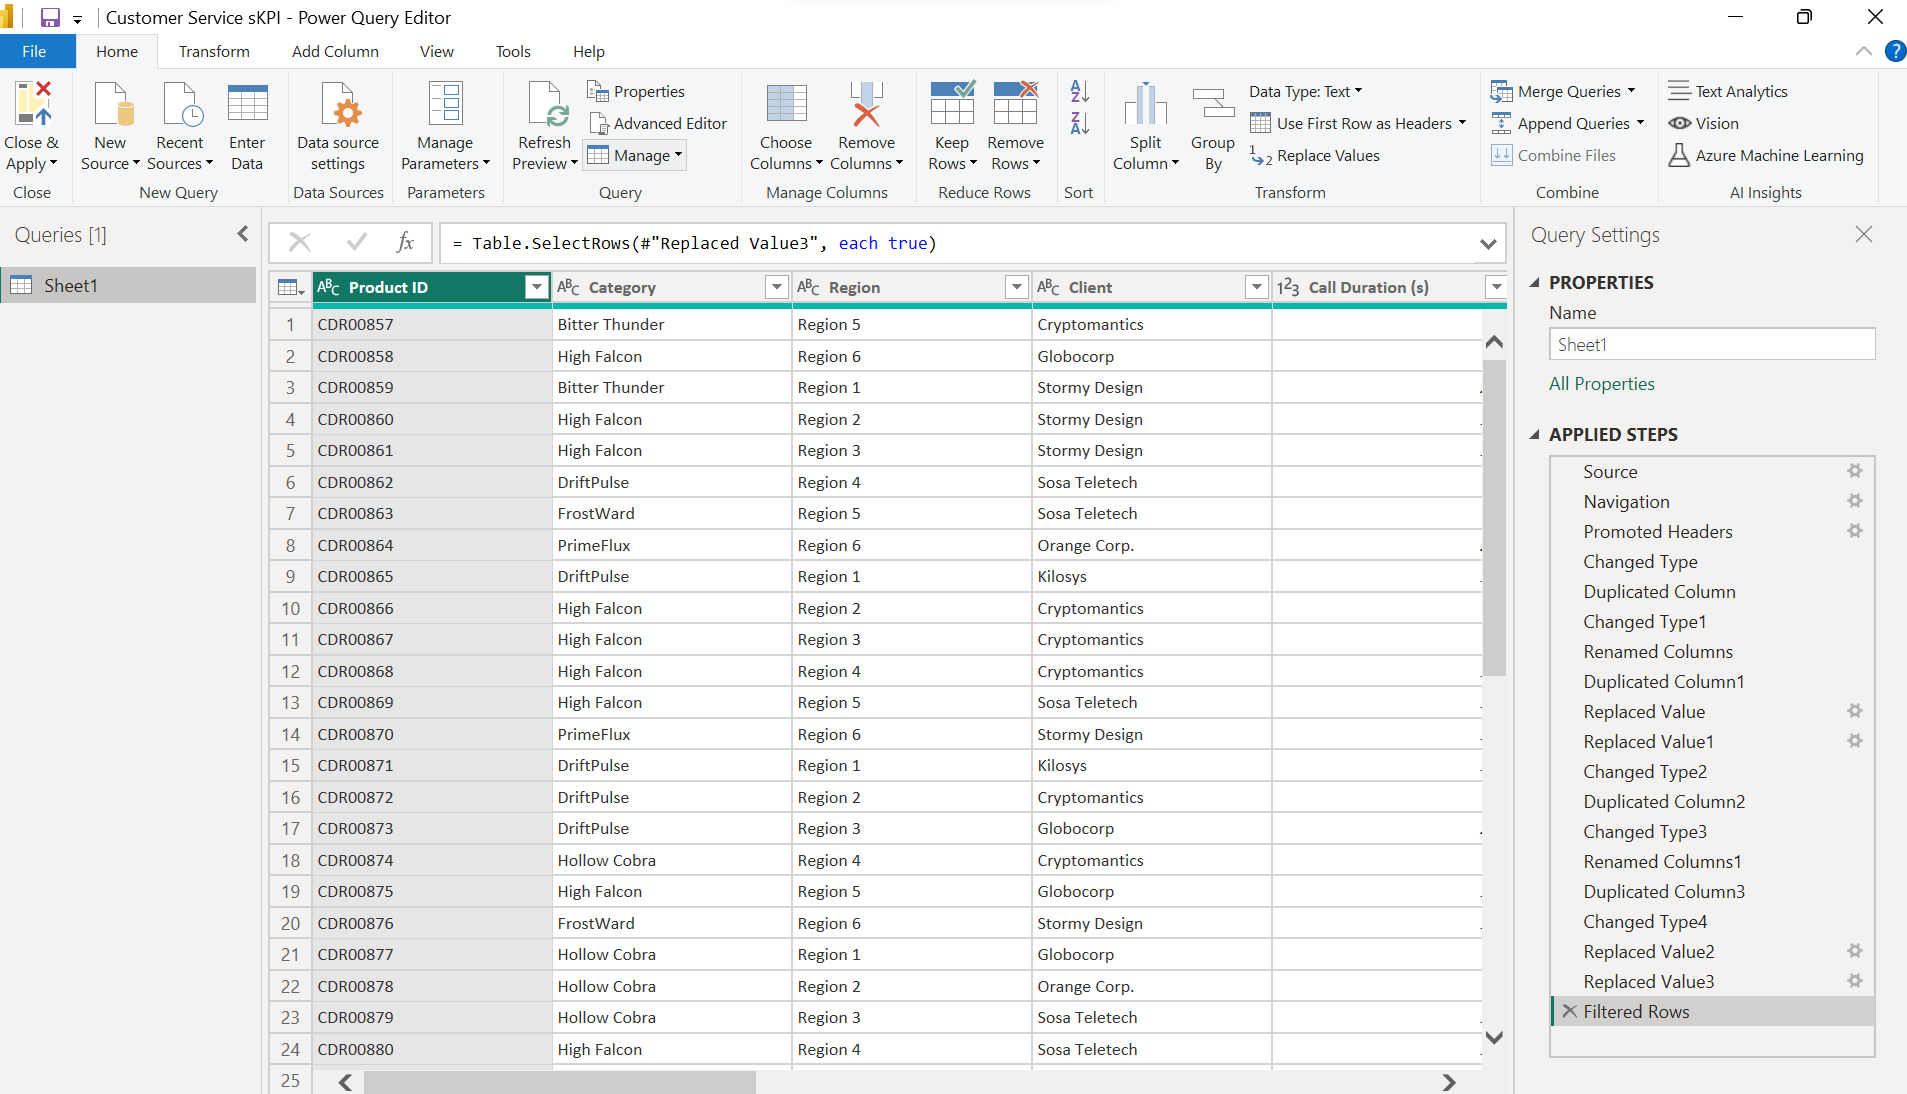
The first step was to do the data prep and discovery within power BI. Luckily, the transform data section in out Power BI session was what we focused on most, so this was easier to do. It is also fairly straightforward and easy to pick up as the data did not need much cleaning.

Once I wrote a clear summary of the data and what is was showing i started to play around with the tools in Power BI. This was a lot more complicated than I originally planned as I did not know how to use many features. Calculations such as 'Percent of total' and 'Ranks' were really hard to find so after a trying for a while I decided to prioritize other charts I already knew how to create.
I was originally going to split my dashboard into 3 sections; general overview, Agent analysis, region analysis and client analysis. However, after finishing both the general and admin analysis I quickly realized I would not have enough time to complete them all.
My general overview consisted of 3 BANs and graphs which provide more context to these numbers. I originally created a whole section going into greater detail for these charts but I had to prioritize.

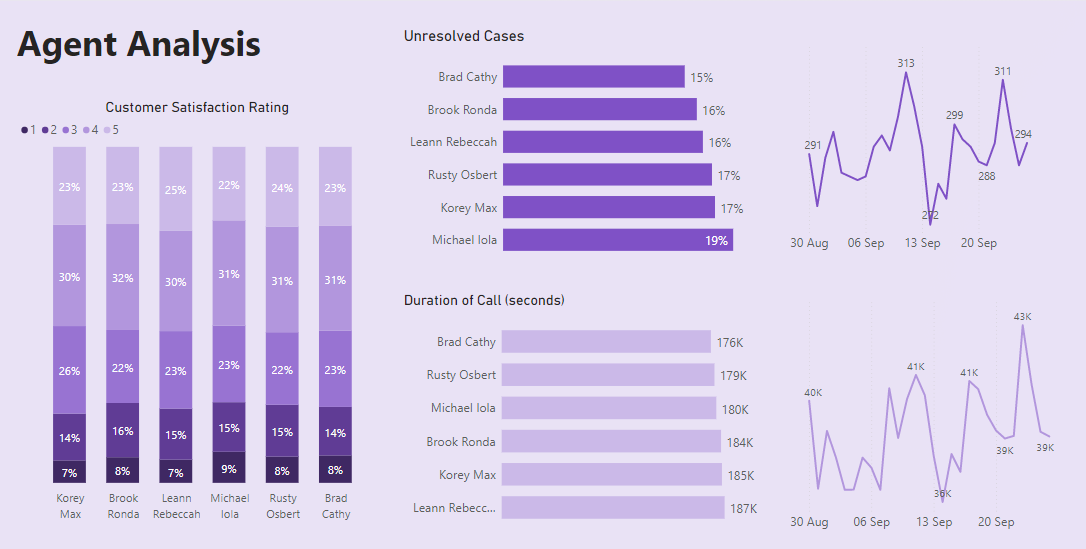
The agent analysis consisted of different graphs which were meant to have filter actions but due to time limitations I was unable to figure the filter actions and the filters affect the entire dashboard incorrectly. Clicking on a bar was meant to only affect the line charts but I could not figure this out in time.

Finally, uploading the dashboard onto Power BI was very challanging and I definetly left it too late! I would really suggest leaving more time for this as it is not as intuitive as tableau public...
Overall, this was a very challenging experience. I did not realize how long it would take me to complete simple charts and as a result overcomplicated my dashboard and ran out of time. In the future I would focus my dashboard entirely on a general overview and spend more time on the filter actions.
This was a very valuable experience and I am much more confident in my Power BI abilities!
