


For todays challenge we were meant to use Alteryx and APIs to get data from the Rick and morty API website.
This was very challenging as we were not taught APIs yet and needed to use this to extract the information from the website.
My data prep was all done using Alteryx with a very long workflow which took around 3 hours to complete.
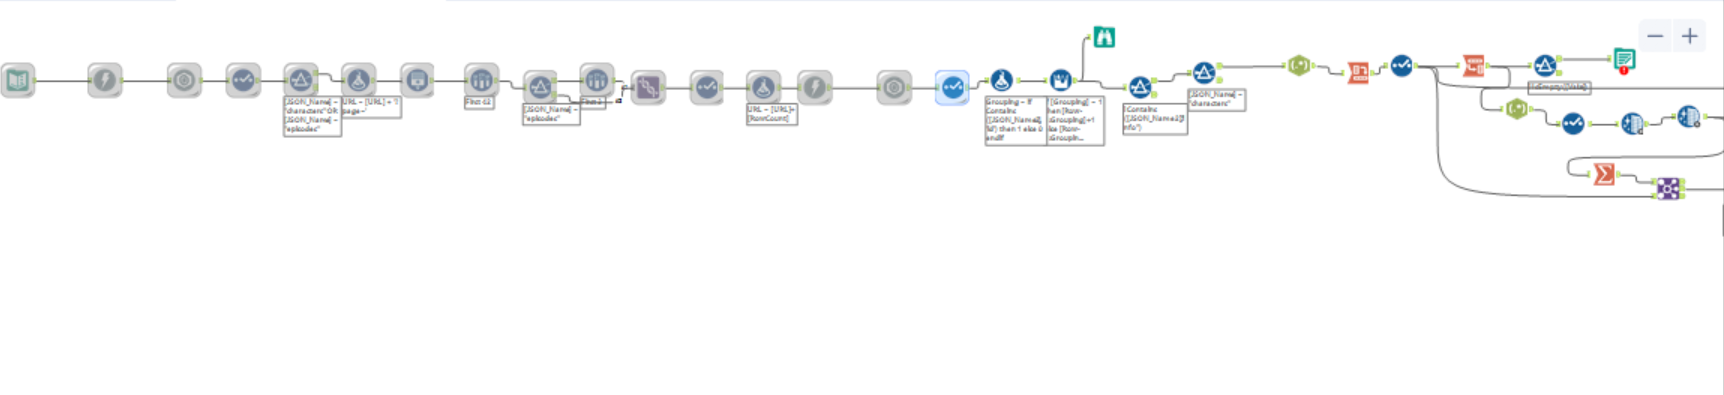
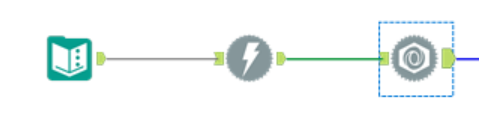
The first thing was to download the data using a data input tool with the REST API URL, then using the JSON parse tool to extract this.
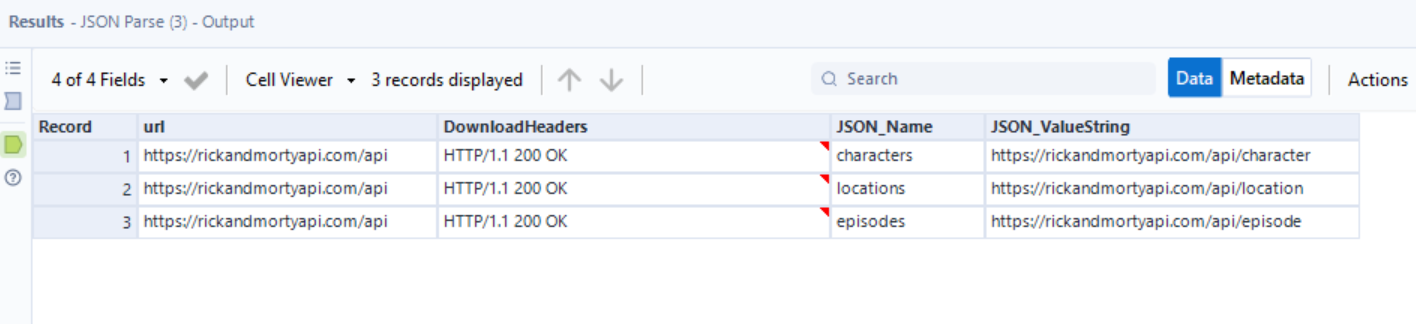
I then wanted to filter out any data for the location (which I later realised was not needed as the character field had all the information about location and episode). Next I found the number of pages and characters there were for the character and added the amount of rows as well as adding the page number to the url. After this, I repeated the download and JSON parse with the new URL with the individual page numbers. After this, I parsed the data to have the individual fields along with their values using the multi row formula.
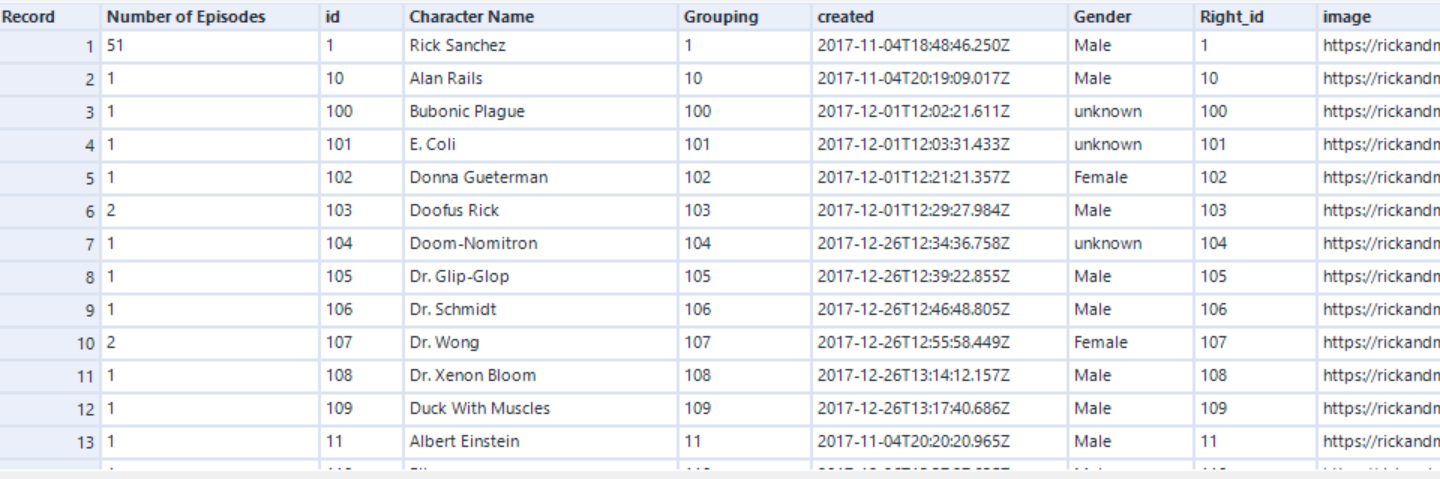
My final output:
Once I had my desired output I uploaded this to tableau and started brainstorming how to visualize my data. This was a lot more simple and I used example on tableau public and Pinterest for inspiration.
My plan was to split my dashboard to show:
- Which Character Appeared in the Most episodes
- What were the genders of the new characters and how they changed over time
- What made a character more likely to die (i.e. the less they appear in an episode, their gender etc)
I nearly managed to do all of what i originally planned with the exception of how gender affected death. If I had more time i would also have included data on IMDB ratings to see if certain episodes with individual characters are more likely to have higher ratings.
This was a very challanging dataset, and the formatting of the dashboard took more time than expected. However, I feel as I am more confident using API in Alteryx and will be able to use it more easily in future work!