Well today was ... interesting. We were given a dataset containing information about bicylists traffic in Seattle, but the main challenge for this was to build in Tableau Public WebEdit - something we haven't done before - but I guess that's the fun of Dashboard Week eh!
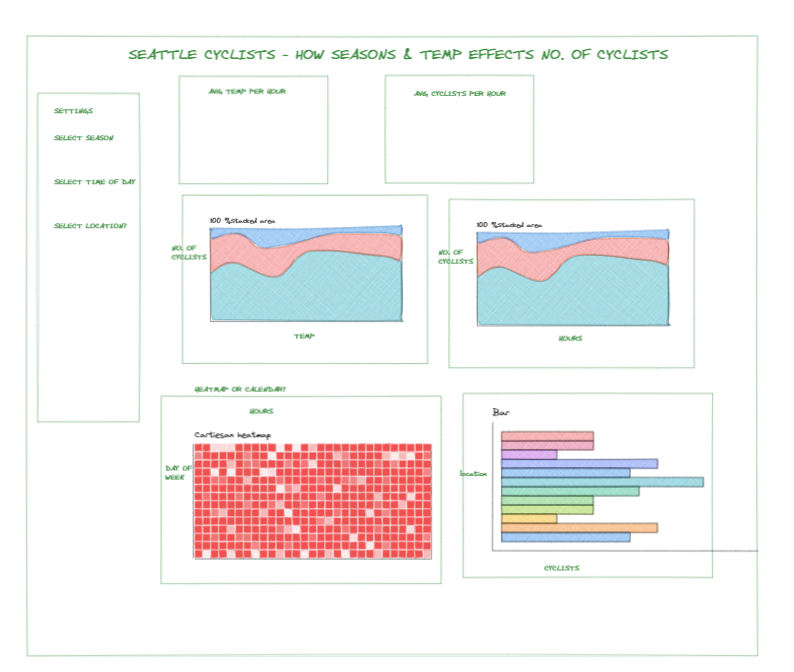
The dataset contained hourly information from Jan 2014 - Jan 2022, my original idea was to look at seasonality and how temperate also effects the number of cyclists - we'd expect to see this peak in Summer, but I thought it would be cool to visualise this.
Here's the idea I had:

The data didn't need a lot of cleaning - you can find the all datasets used here: https://data.seattle.gov/, but I had 10 files (different locations) that I had to clean up and join together. So I put these into Alteryx and into a format that would work for my analysis.
Here is a line of my workflow (ignore the current mess) - repeated for all 10 datasets

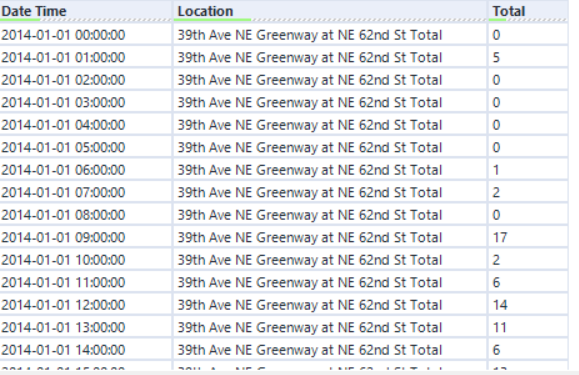
The outputs were unioned together to give me an output in the following format:

The temperate dataset (I thought) was easy to find - https://dev.socrata.com/foundry/data.seattle.gov/egc4-d24i
So the first disaster happened with the temperature dataset, there were 1.25million rows, so I'd assumed there would be enough data to suppliment the original dataset, however after getting this into the format needed and joining with my other dataset I realised I'd lost a lot of data - I could however see data for 2019,2020 which would have been plenty to use for my original plan - but I was wrong.
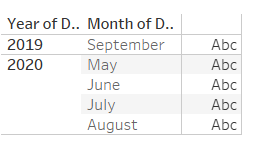
After checking this in Desktop I only had the following data, which wouldn't be sufficient for a temperature analysis:

Then came the failed API call - although the page says 'Date created - 2014' and also that the data was updated hourly, the call would only give me a sample of 1000 rows. So my original idea was scrapped - with only 2 hours to go!
So I used the original output to build my viz.
Now onto webedit.... all I can say thank god for Desktop! There's lots of things that quite frankly we take for granted, I won't go into the details - if you're reading this you can try it for yourself and see!
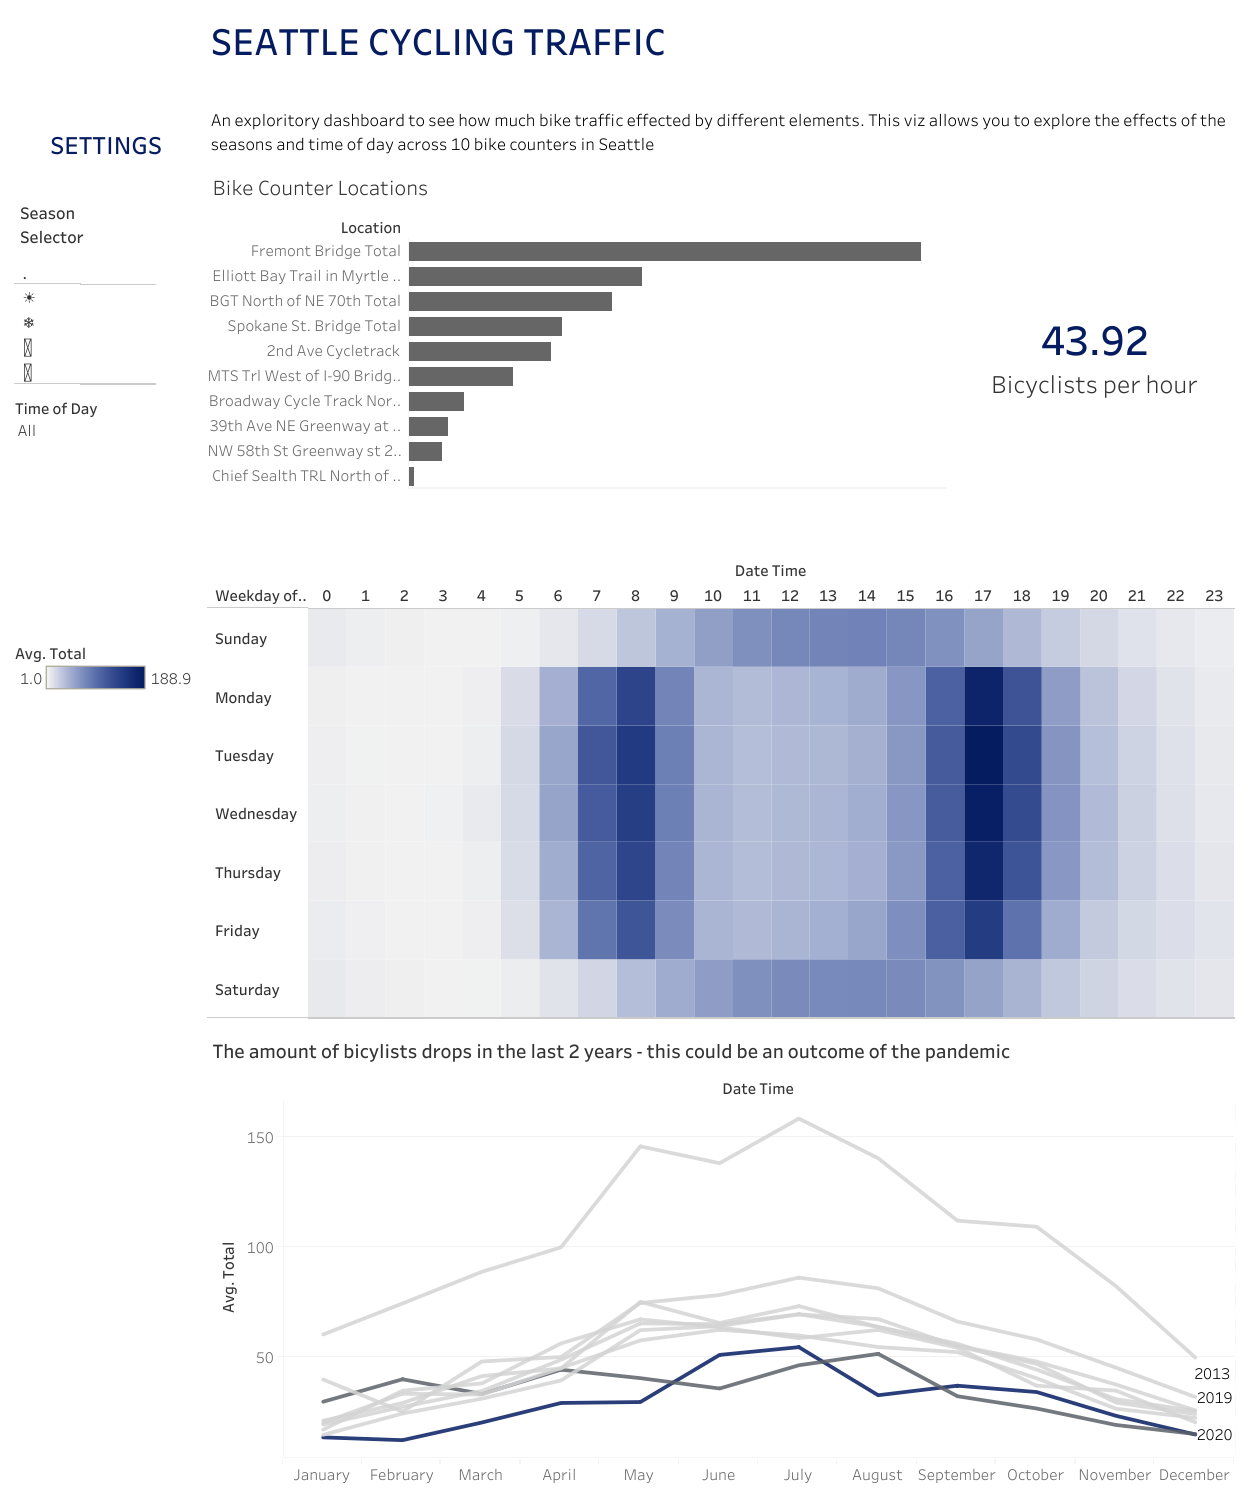
Here is my final dashboard - https://public.tableau.com/app/profile/katie.matkin/viz/DashboardWeekDay3_16486499961970/Dashboard1

Not my best work by far, but I pulled this together within the last hour of the day!
Lessons learnt:
- Although I used the browse tool, I didn't inspect the data properly, I just read the web page and went with the information on there
- Planning out prep better - although I planned out my design, I hadn't really planned the data prep - it may have been less chaotic if I did!
