


What is Linear Regression Analysis?
Linear Regression Analysis is essentially finding a 'line of best fit'. The aim is to find a linear relationship to describe the correlation between an independant variable and a possible dependent variable.
For example:
Independent variable - Time spent revising for an exam
Dependent varibale - Marks in the exam
Why is this useful? Well, we can then use this to predict missing values - also known as interpolation.
Here's a snapshot of the data I'm going to use in the next examples:
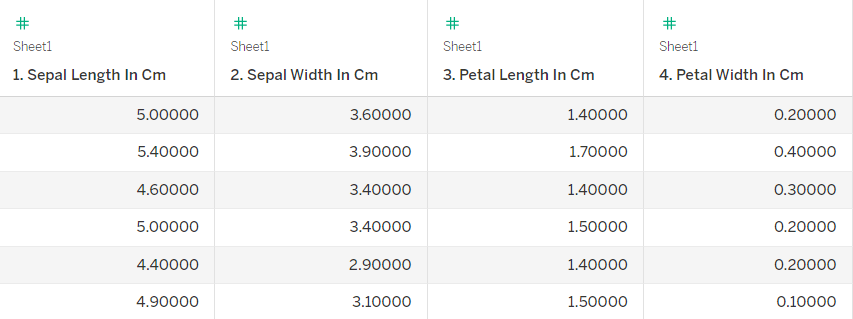
We want to show the relationship between petal lengths and petal width to deterime how well we can predict the petal width using the petal length.
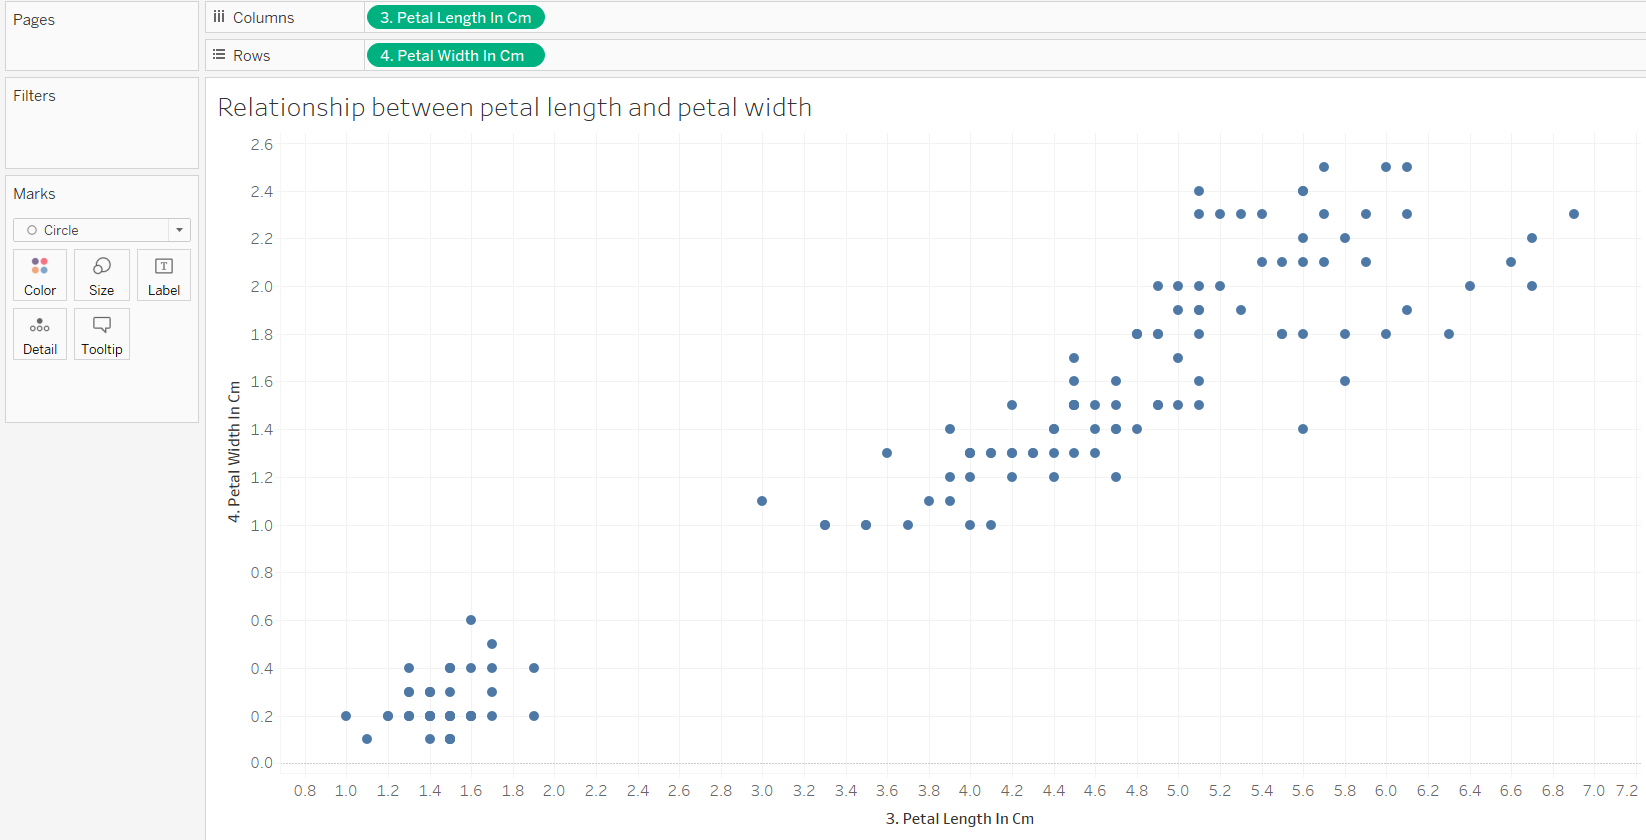
In Tableau:
Taking the petal length as the independent variable and petal width as the dependent variable. We have something that looks like this:
Now add on a trend line - selecting 'Linear' to show the correlation
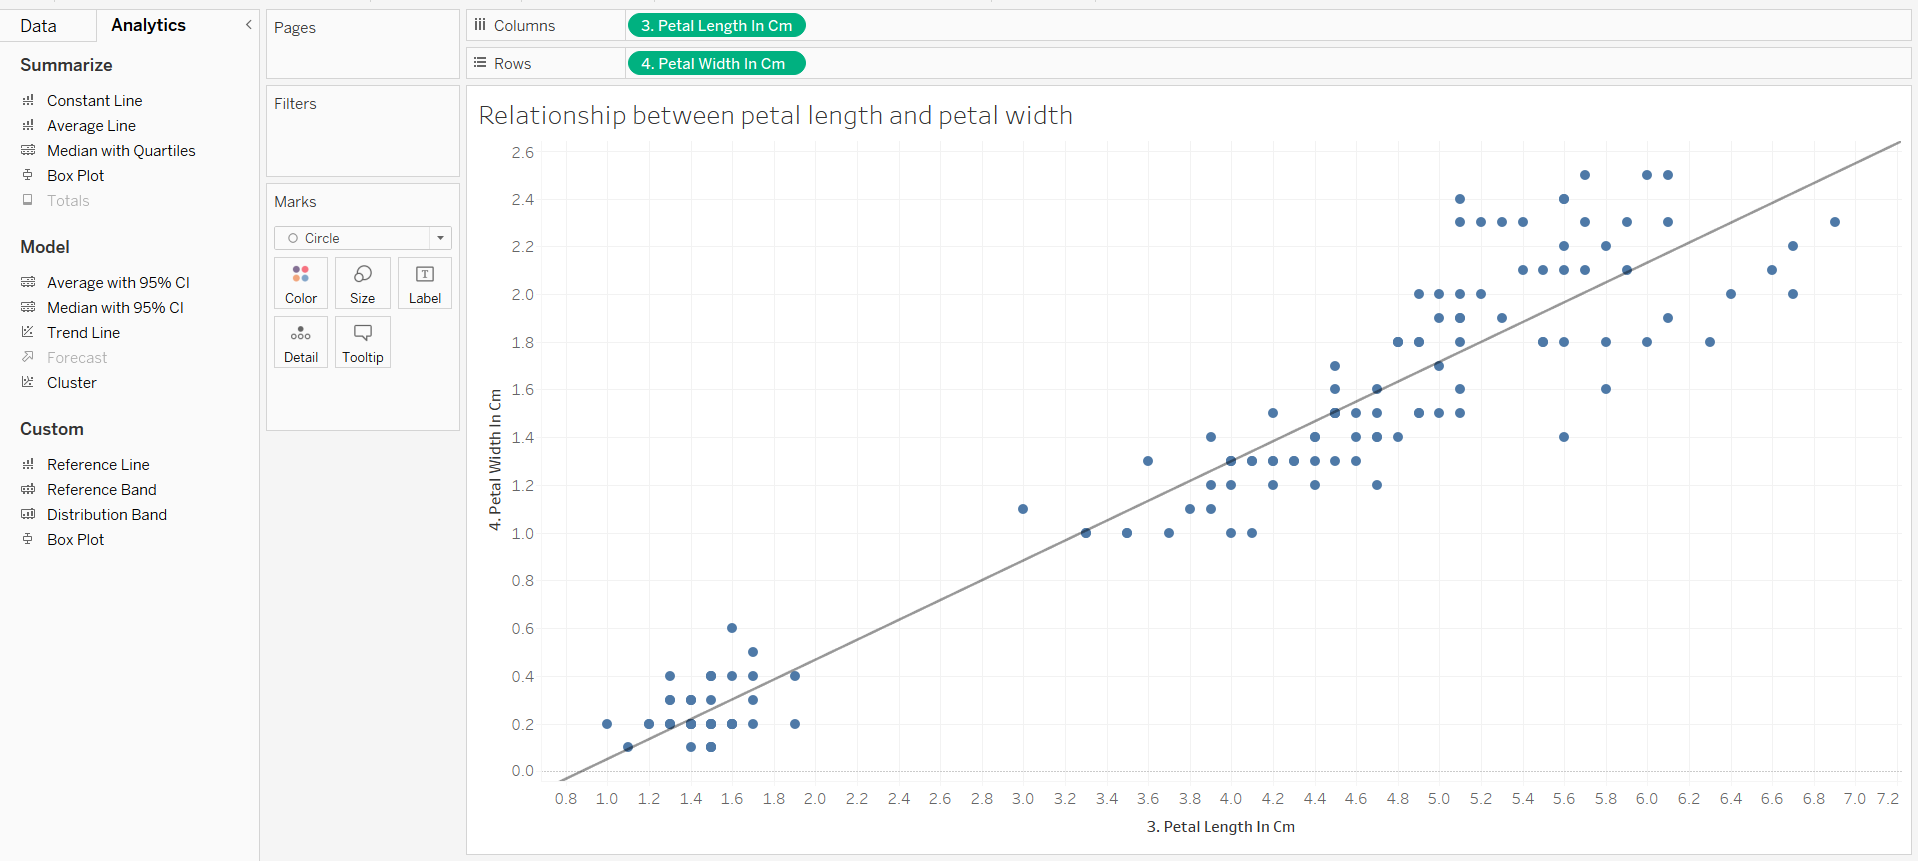
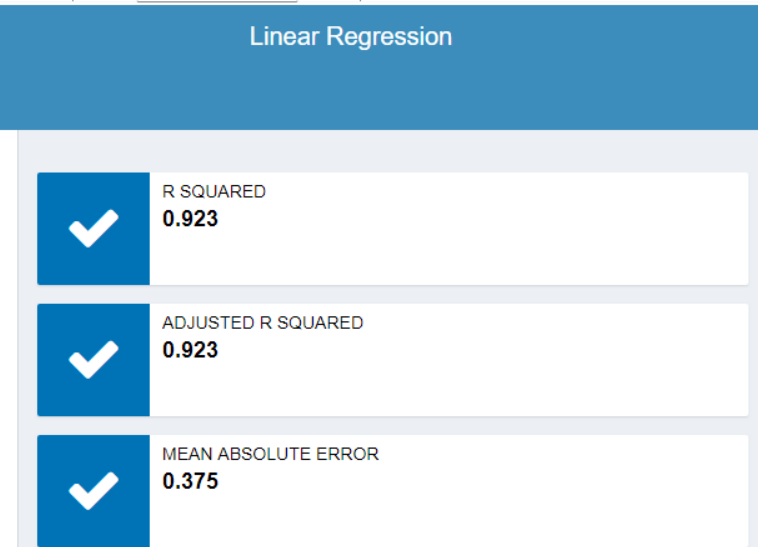
So what does 'R-squared' mean? R-squared captures the proportion of the variation in the dependent varibale (petal width) that you predicted with the independent variable (petal length).
The higher the R-squared (how close it is to 1 or -1), the better the model fits your data.
Now to also try this in Alteryx
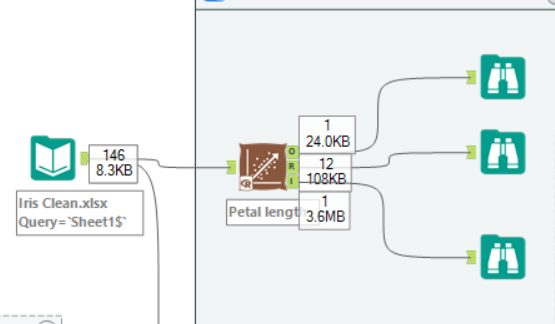
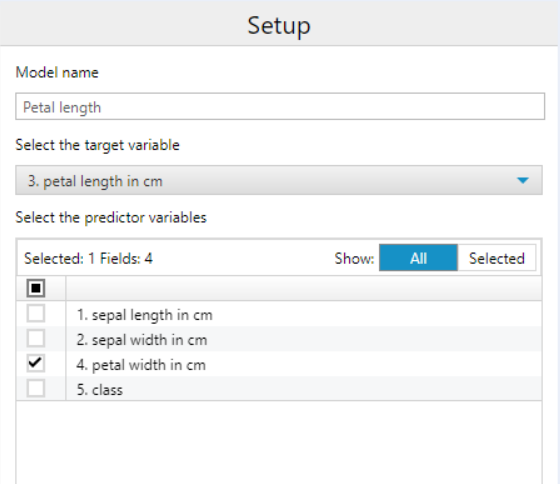
Simply use the 'Linear Regression' tool
Set this up with your target variable and predictor variable
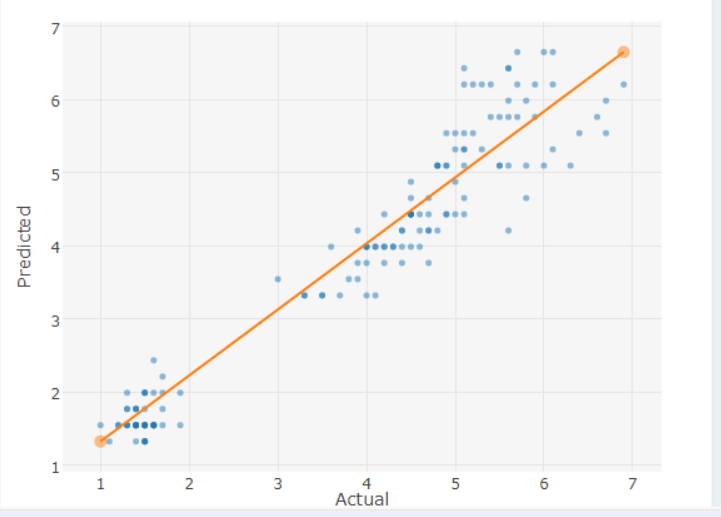
We are given the same result but with different views
So can we use regression analysis on all types of data?....
NO! Your data needs to abide by several assumptions that linear progression makes:
- There must be a linear relationship between the dependent (outcome) variable and the independent variable
- The residuals must be (approximately) normally distributed
- There cannot be any multi-collinearity between the independent variables i.e. they cannot be highly correlated to one another