The access to education is something that many of us take for granted at a young age. There are many, many countries globally that don’t have the access to schools or education like we do.
Childhood Education International focuses on education globally for children, especially the most vulnerable and ages birth to 11 years old .
The organization works through a network of country liaisons throughout the world, volunteers often working in the fields of childhood development, education, and other aspects of the education sector.
These liaisons gather information about childhood education practices and policies and share this info with CE International to help the development of programs and promote intercultural understanding. CE International also serves as a consultant to the UN on their education agenda. (https://ceinternational1892.org/about-us/)
My goal:
I wanted to help bring together data that could support them in finding the areas and ages of those most in need of their services.
This could also help them see if their work is helping improve the education and lives of the areas they are currently work, with by making online public data around literacy levels, school attendance, living environments and employment easily accessible to compre and analyse.
Accessing the data:
I used the following datasets from: https://unstats.un.org/unsd/demographic-social/products/dyb/dybcensusdata.cshtml:
http://data.un.org/Data.aspx?d=POP&f=tableCode%3A22– Population by age, sex & urban/rural residence
http://data.un.org/Data.aspx?d=POP&f=tableCode%3A29– Population 5 to 24 years of age by school attendance, sex and urban/rural residence
http://data.un.org/Data.aspx?d=POP&f=tableCode:31– Population by literacy, age, sex and urban/rural residence
http://data.un.org/Data.aspx?d=POP&f=tableCode:46– Population by type of living, age and sex
http://data.un.org/Data.aspx?d=POP&f=tableCode:320 - -Employed population by status in employment, age and sex
By using the data from each of these datasets, analysis can be drawn on how certain factors have changed over time, and see if there’s specific age groups or areas that are in the most critical need.
I want the viewer to be able to do the following analysis:
- % of totals for illiteracy, school attendance, living situations and employment for all ages and whether this differs by gender
- Do particular living situations have any relation to school attendance, illiteracy, or employment rates
- Comparisons of cause and effect amongst all categories
The flow:
Originally, I have joined the different data sources together, however I lost a lot of data by doing this as the data is survey data so the amount of data isn’t uniform for each data set.
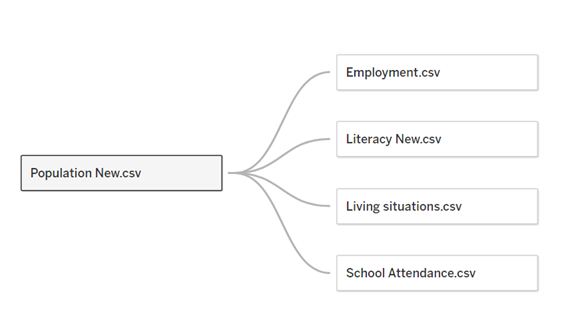
I created four different outputs with the view to create a relationship on Tableau Desktop so all the data can be used either individually or together for different analysis.
The data mainly needed cleaning and ages grouping so they were uniform across each data set, this way each output would be able to be used for analysis.

The links would only allow a download of 100,000 rows of data – this may seem like a lot, but when considering every country, age group and sex – 100,000 rows would only do 1-2 years of data at a time.
So, I used a wildcard union to bring all these tables into the prep so it is all in one place for a user and so they can add more data over time.

Building a relationship in Tableau
There are many benefits to using relationships in Tableau Desktop, mainly that all the measures are preserved so the tables can be analysed individually, or multiple at one time – which is exactly what I wanted my viewer to be able to do. In this use case, as previously mentioned a lot of data would have been lost through joins on either Prep or Desktop.
I joined all tables by Country, area, sex, age and year


I’ve put together an example of some analysis that can be done using the data and an idea of how I envision this to be used.
I haven’t answered all the questions I’d previously mentioned, but the data can be used for comparisons, looking at cause and effects and the main areas that are in need of support.

