This mornings session was all about Accessibility when creating visualisations. Colour blindness is probably the most obvious, however there are many other things that we need to consider - a lot that were new to most of us today!
Following this session, we were given a dataset looking at Obstructions in and around Glasgow, with data about potholes and pavement/footpath obstructions. The task was to create a viz about this data that would be first of all useful, but the main challenge was to include many of the accessiblity aspects that we'd discussed in the morning session - we didn't have as much time as yesterday, so we had had to plan very wisely.
Similar to day 1, we were allowed to suppliment the dataset with another if we wanted to. I'd ideally wanted to look at cycle routes and be able to show the locations of the obstructions - but I ended up just wasting a lot of time looking for another dataset! After revisiting the data we were given, I revisited my plan and dropped the idea of adding data, there was actually enough to work with this just ended up being a time-wasting task for me!
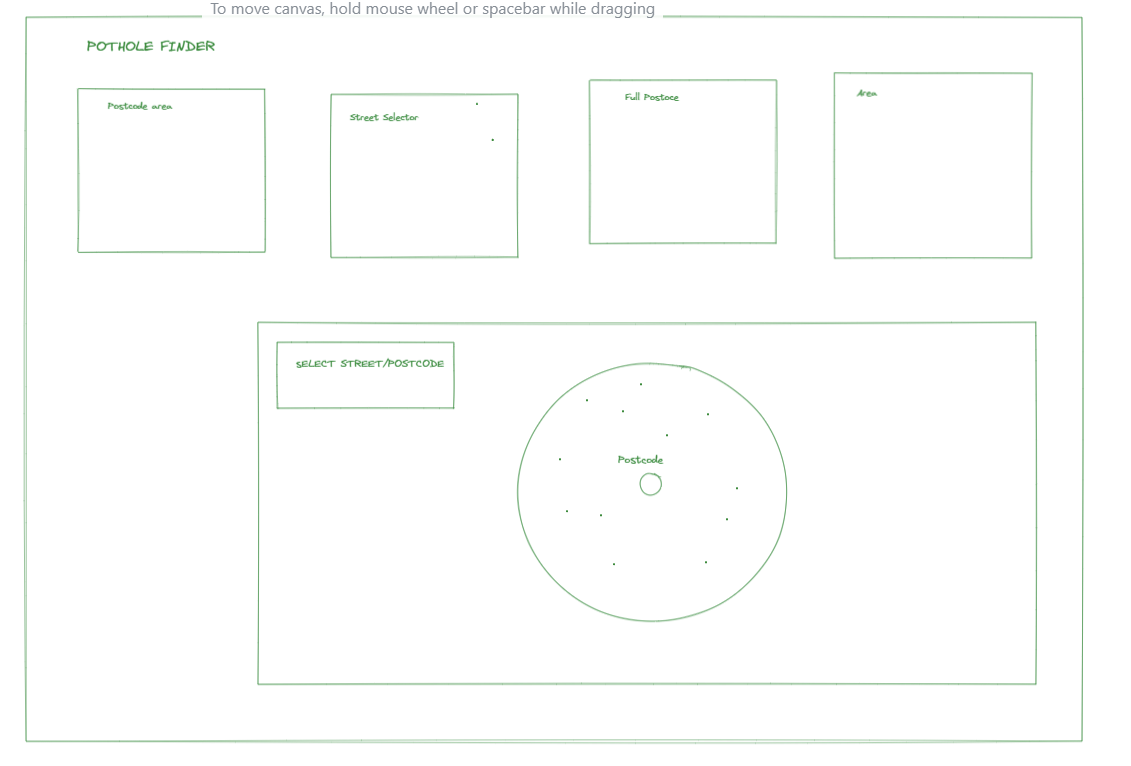
I've included a plan of my (very basic) plan below. My idea was to keep it quite simple to understand and to interact with rather than creating an overcomplicated viz - as mentioned, the task was to focus on accessibilty. I also decided to narrow this down to focus on just potholes for now - with the view to add in the pavement obstructions, however time wasn't on my side.

The data didn't need much cleaning, but I did a very quick cleanup in Alteryx so the data was in a format that would make my viz easy to build.

I'd planned to include essentially an easy 'select' function with the BANs at the top of dashboard, so a user could select their postcode, area or street and be able to easily see the obstructions/potholes.
The next idea was give the user the option to select their postcode and see how many potholes were within an 'x' radius of their postcode, and also show locations of each of these. I had to use the Buffer function in Tableau Desktop - I'd never used this before and it was a bit tricky and I'm also unsure of the accuracy. I did get some help with this but it's definitely something that I need to look into so I can understand what it is that Tableau is doing.
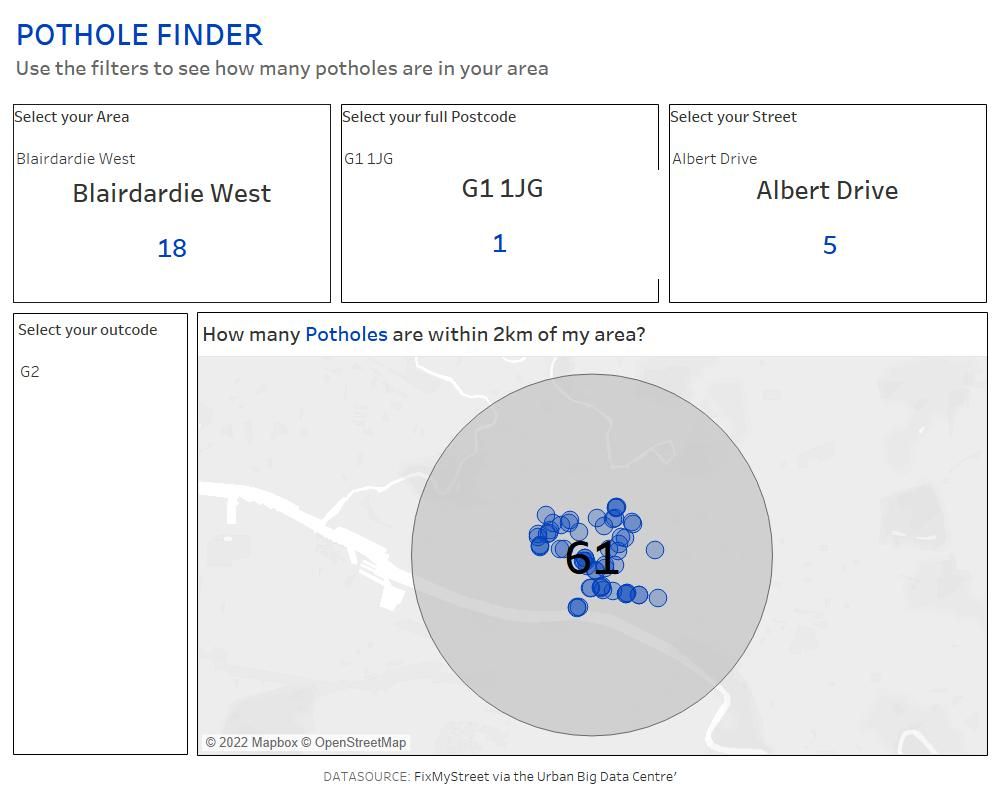
The viz ended up looking as so:

The dashboard was easy to navigate taking into condiseration accessibilty, however there are many, many things that I would change.
A few issues I came across with the mapping were as follows:
- I was unable to move the label in the centre of the map - the usual allignment function doesn't seem to work
- When selecting some postal codes there would be pothole locations outside of the radius, so I'm unsure if the 'buffer' function takes the postal code as the centriod
Overall, this was actually quite an eye opening task. I'd only really consideration colour blindness when building out a viz, and creating something that is truly accessible to a wider audience really makes you think about what you are building and who the potential audience could be but will definitely be something that sticks in my mind in the future!
