Today's task was to analyse London Marathon Runners from 2014-2021 - there's of course a lot of participants so we had to use the first two letters of our surname to narrow down the results. You can find the data here https://www.tcslondonmarathon.com/results/race-results
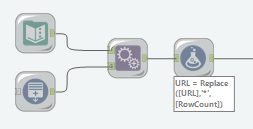
The first stage was to web scrape the data and build a workflow in Alteryx that would parse out the relevant information. There were between 50-56 pages for each year with my filtered results, so I used the generate rows tool and replaced the page number with a *, appeneded these together and then used the number to replace the * in the URL.

Next came a series of regex tools to parse out the information - it's been a while since I've had any practice with web scraping so this was pretty tricky - but with the help of my fellow cohortees we were able to get most of the data. The structure was the same for 2014-2018, but 2019-2021 required a different workflow, in the end I ended up with data from 2014-2018 and 2021 - I decided to leave 2019 & 2020 due to lack of time.
One thing that I noticed was that the intials filter hadn't worked (everyone had the same issue) - however it was too late in the day to change this.
I then wanted to calculate any average pace for my original idea (which I ended up completely changing):


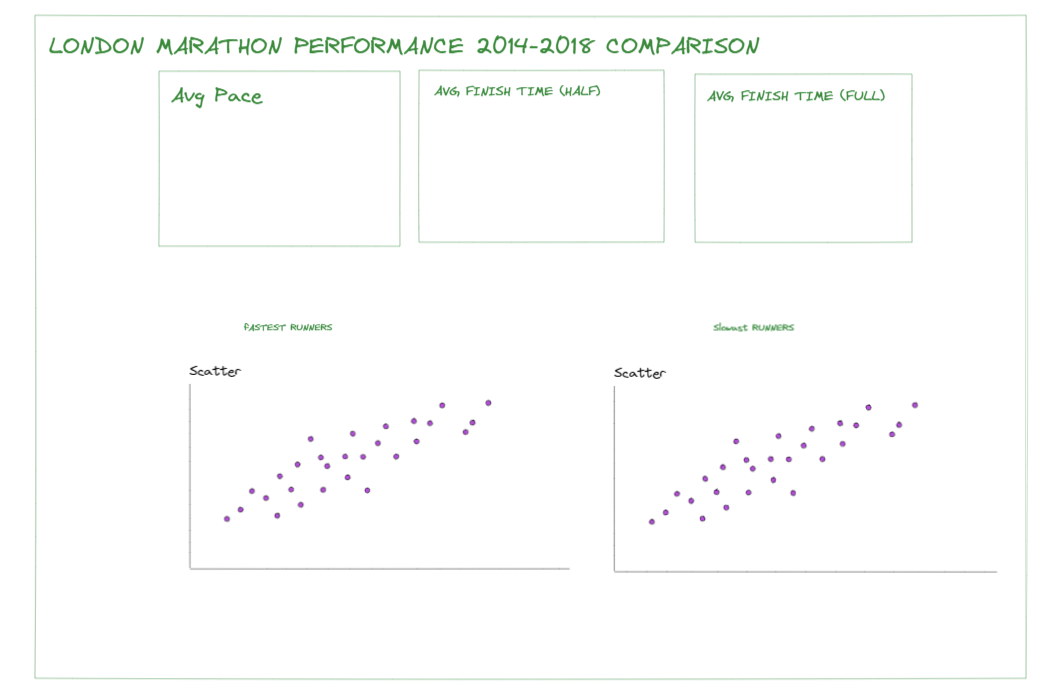
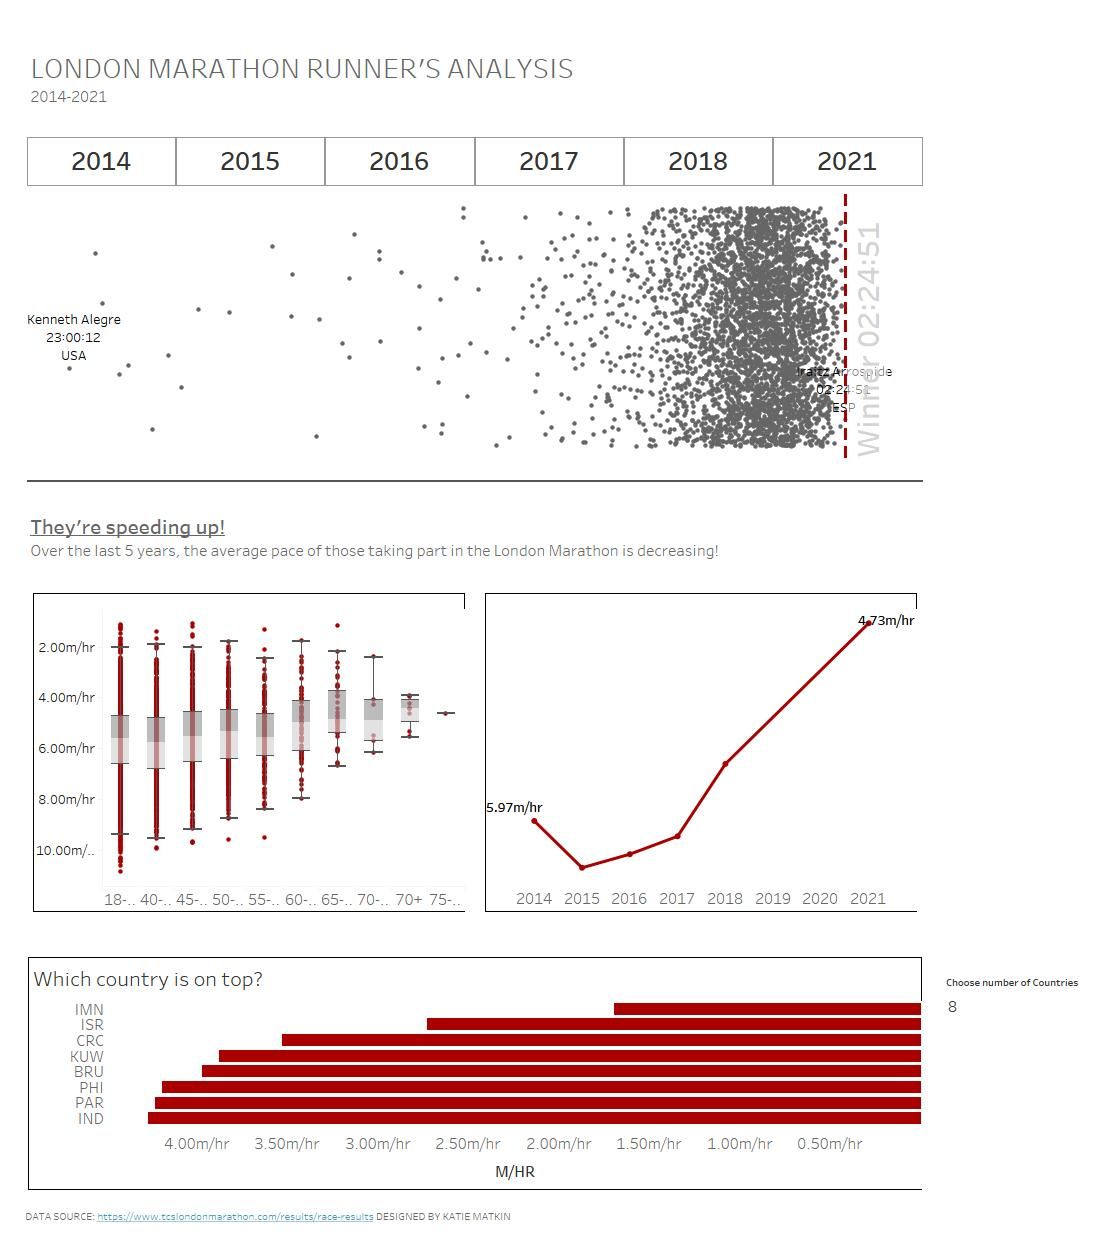
After unioning the tables together it was time for Tableau. When I set about building out my plan I wasn't really too thrilled - so I decided to focus on pace over the years.
And here is my final dashboard:

The visualisation side of things did feel a little rushed in all honesty and there's a few things I would change! Today's been the toughest day of Dashboard Week - but only one day to go!
