In this blog I am going to explain two ways to create a Control Chart in Tableau using London Airbnb Data to show Standard Deviation. This chart will focus on Average Price of Airbnb's over time.
Static Standard Deviation
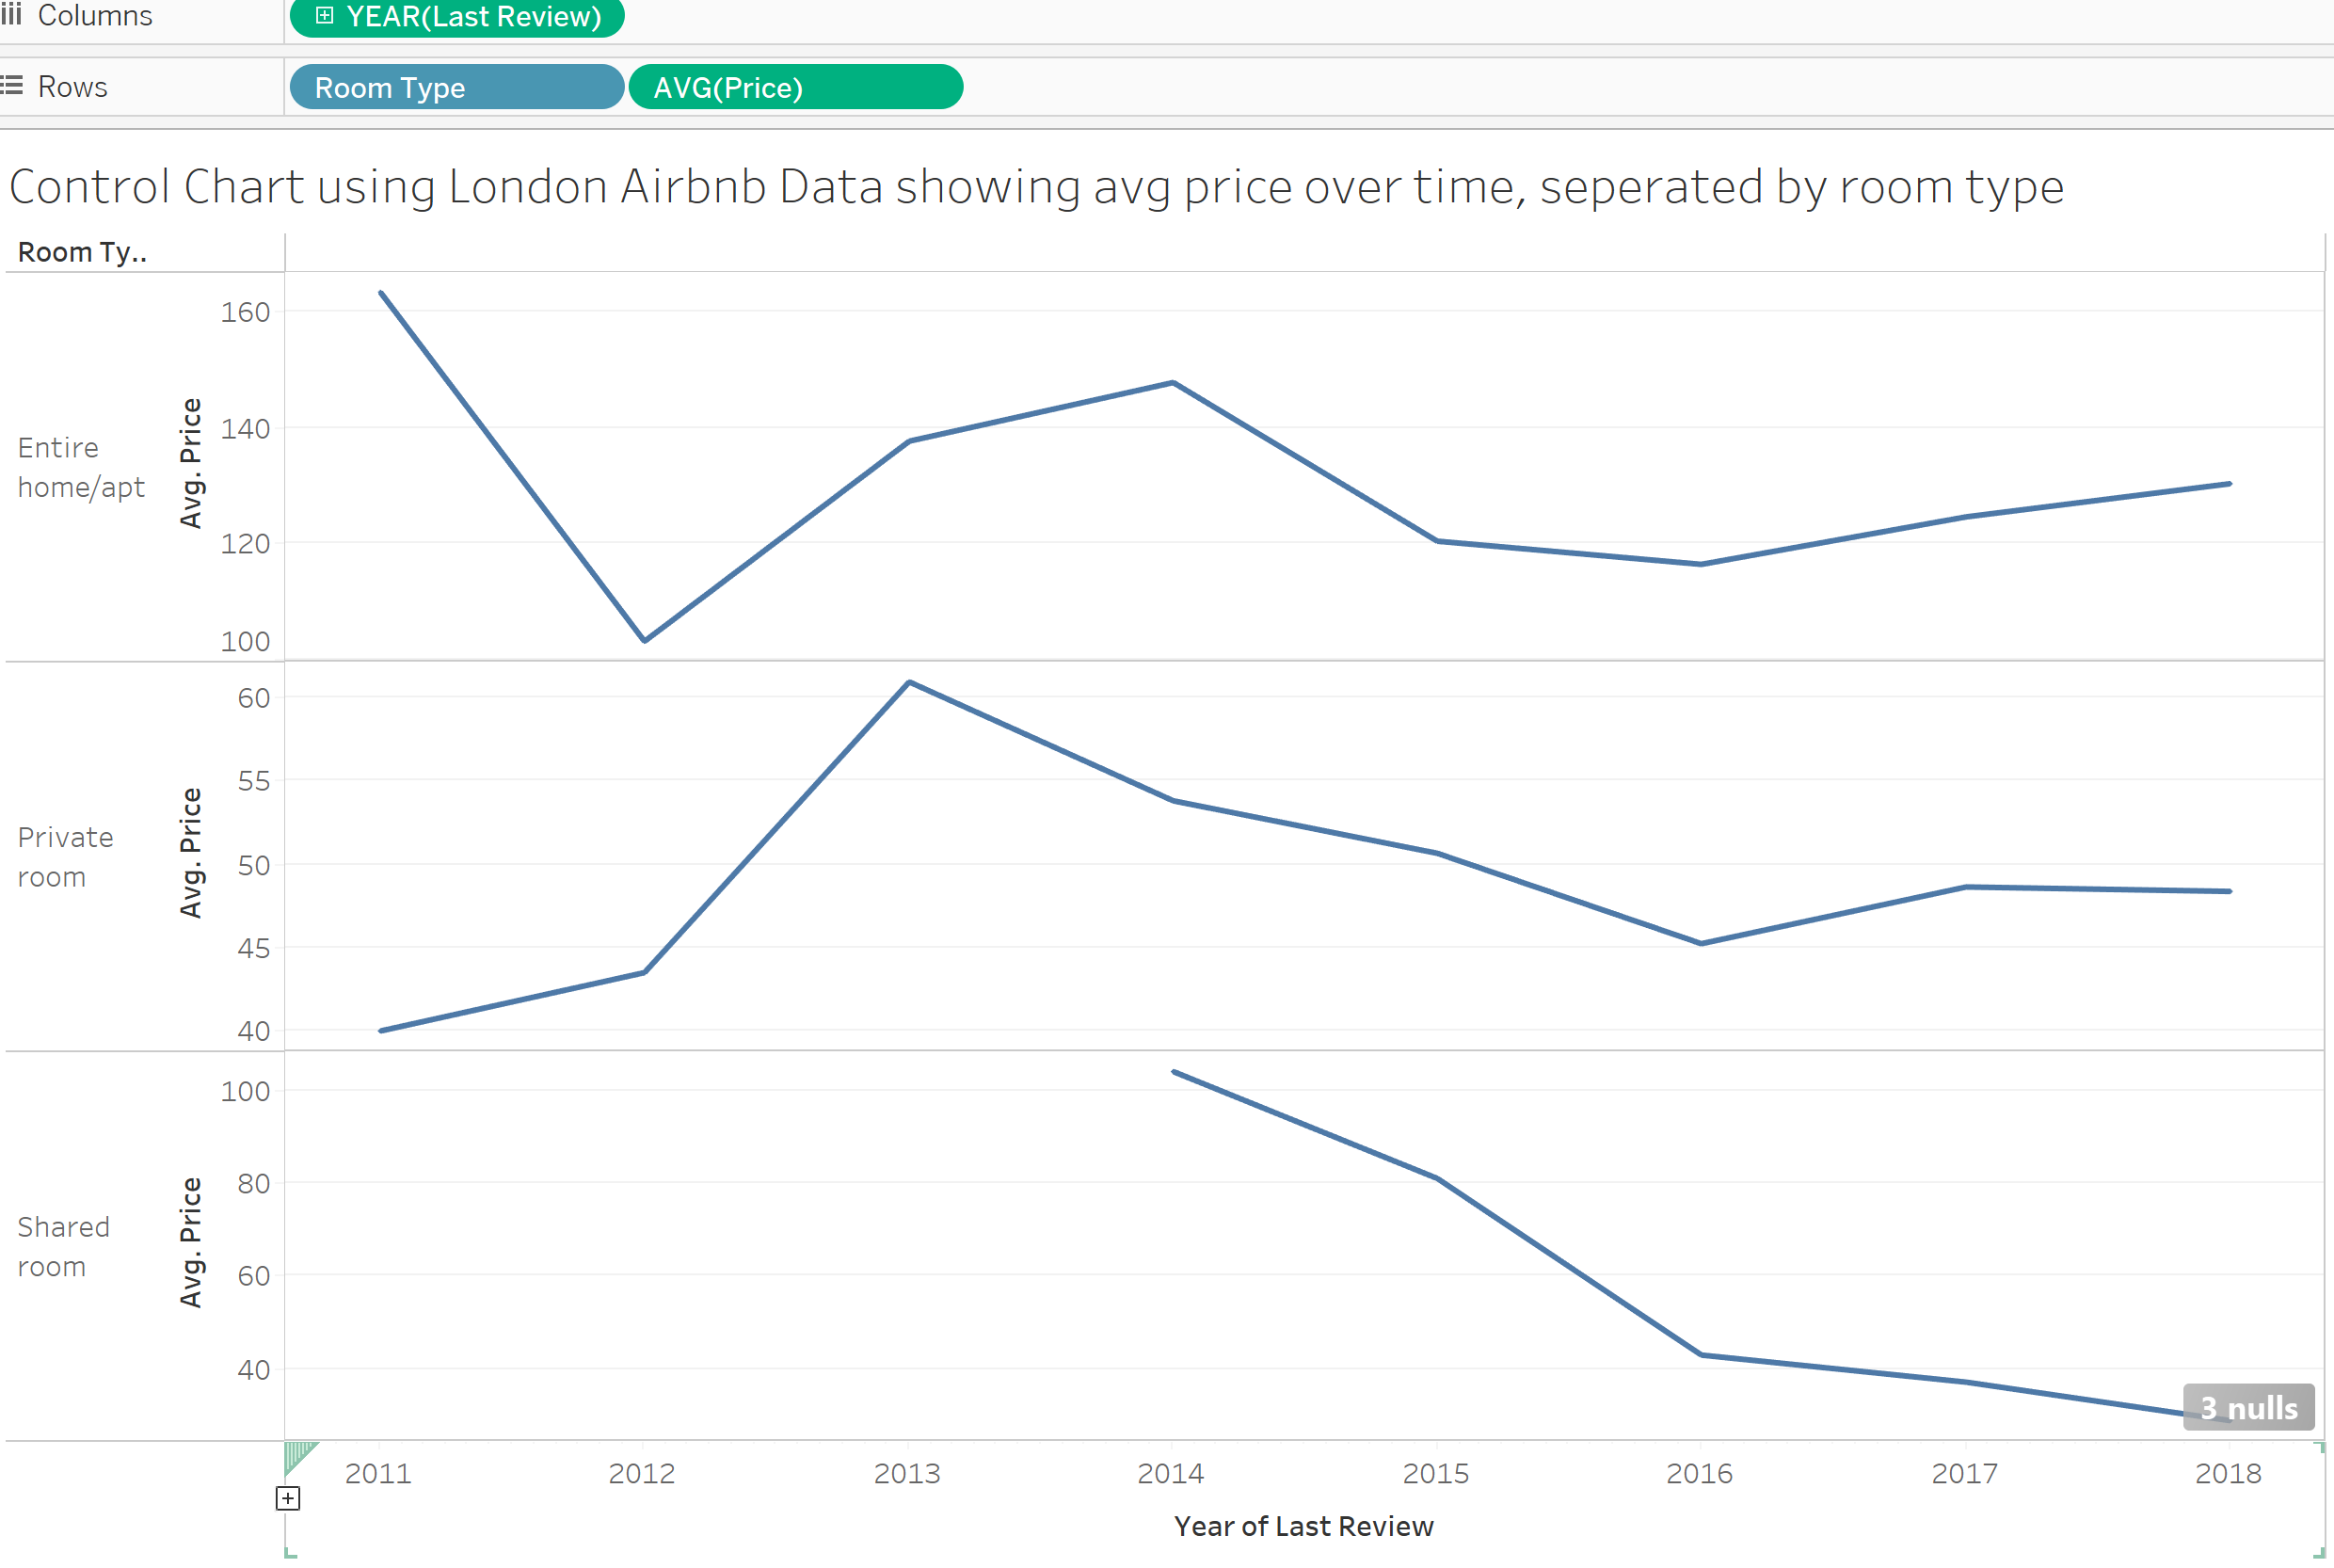
To start, you need to identify what dataset you are using. From here, you want to identify what fields you are going to focus on. For the purpose of this blog, I will focus on 'Room Type', 'Last Review' Date and 'Avg Price'. Drag your Room Type to rows, and right click and drag your Last Review dat to Columns - select year (The year needs to be continuous). Also, right click and drag your price field to the rows adjacent to the room type and make this the average. You can now right click on the Y axis and deselect 'include zero' and make the axis independent of each other! Your view should look like below.
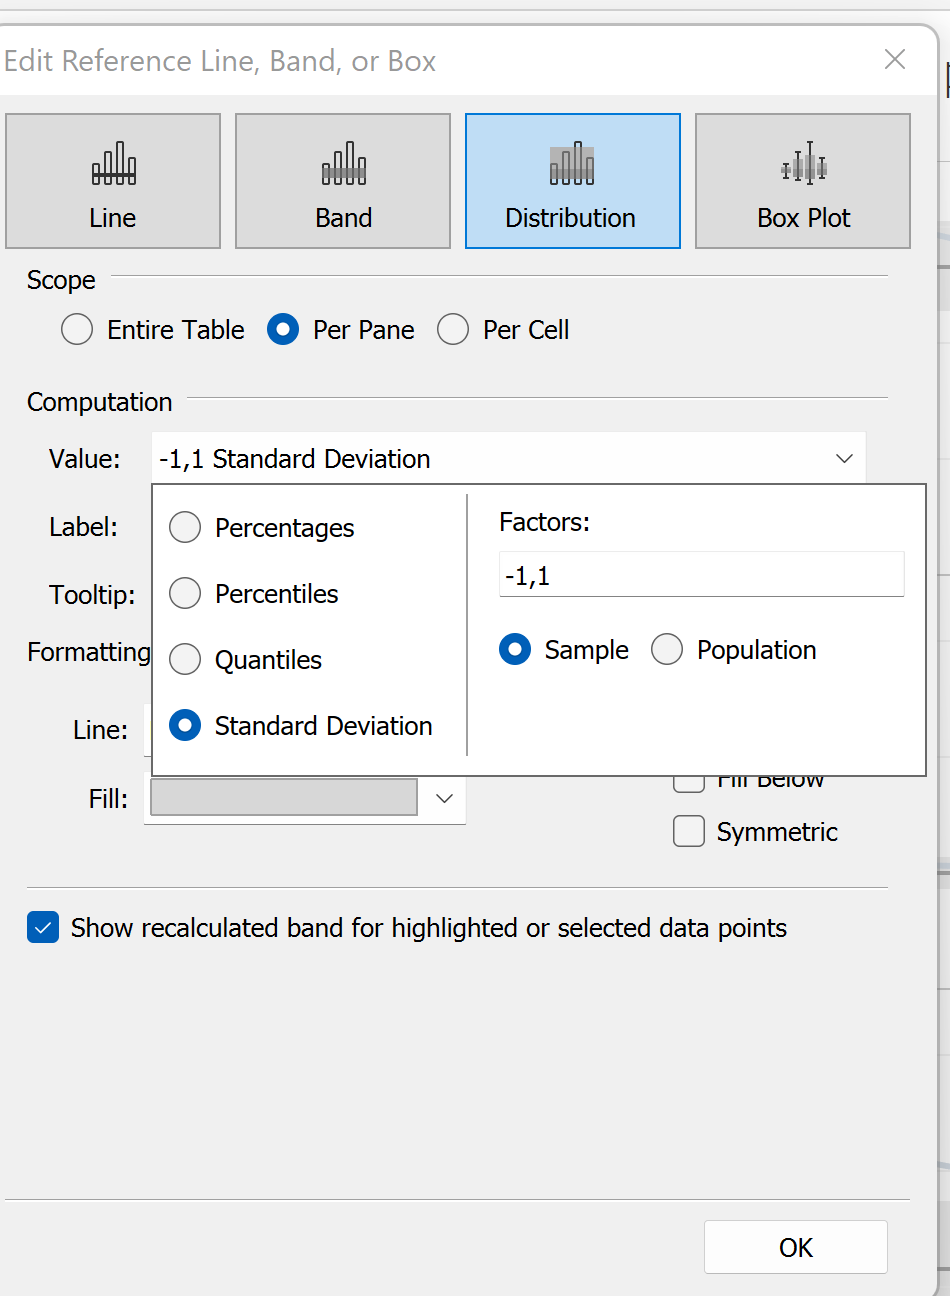
From here we want to add in a Average Line and this can be found in the Analytics pane. Drag the average line into the view and place it in over Pane. We also want to add in a distribution band to show the standard deviation (SD).
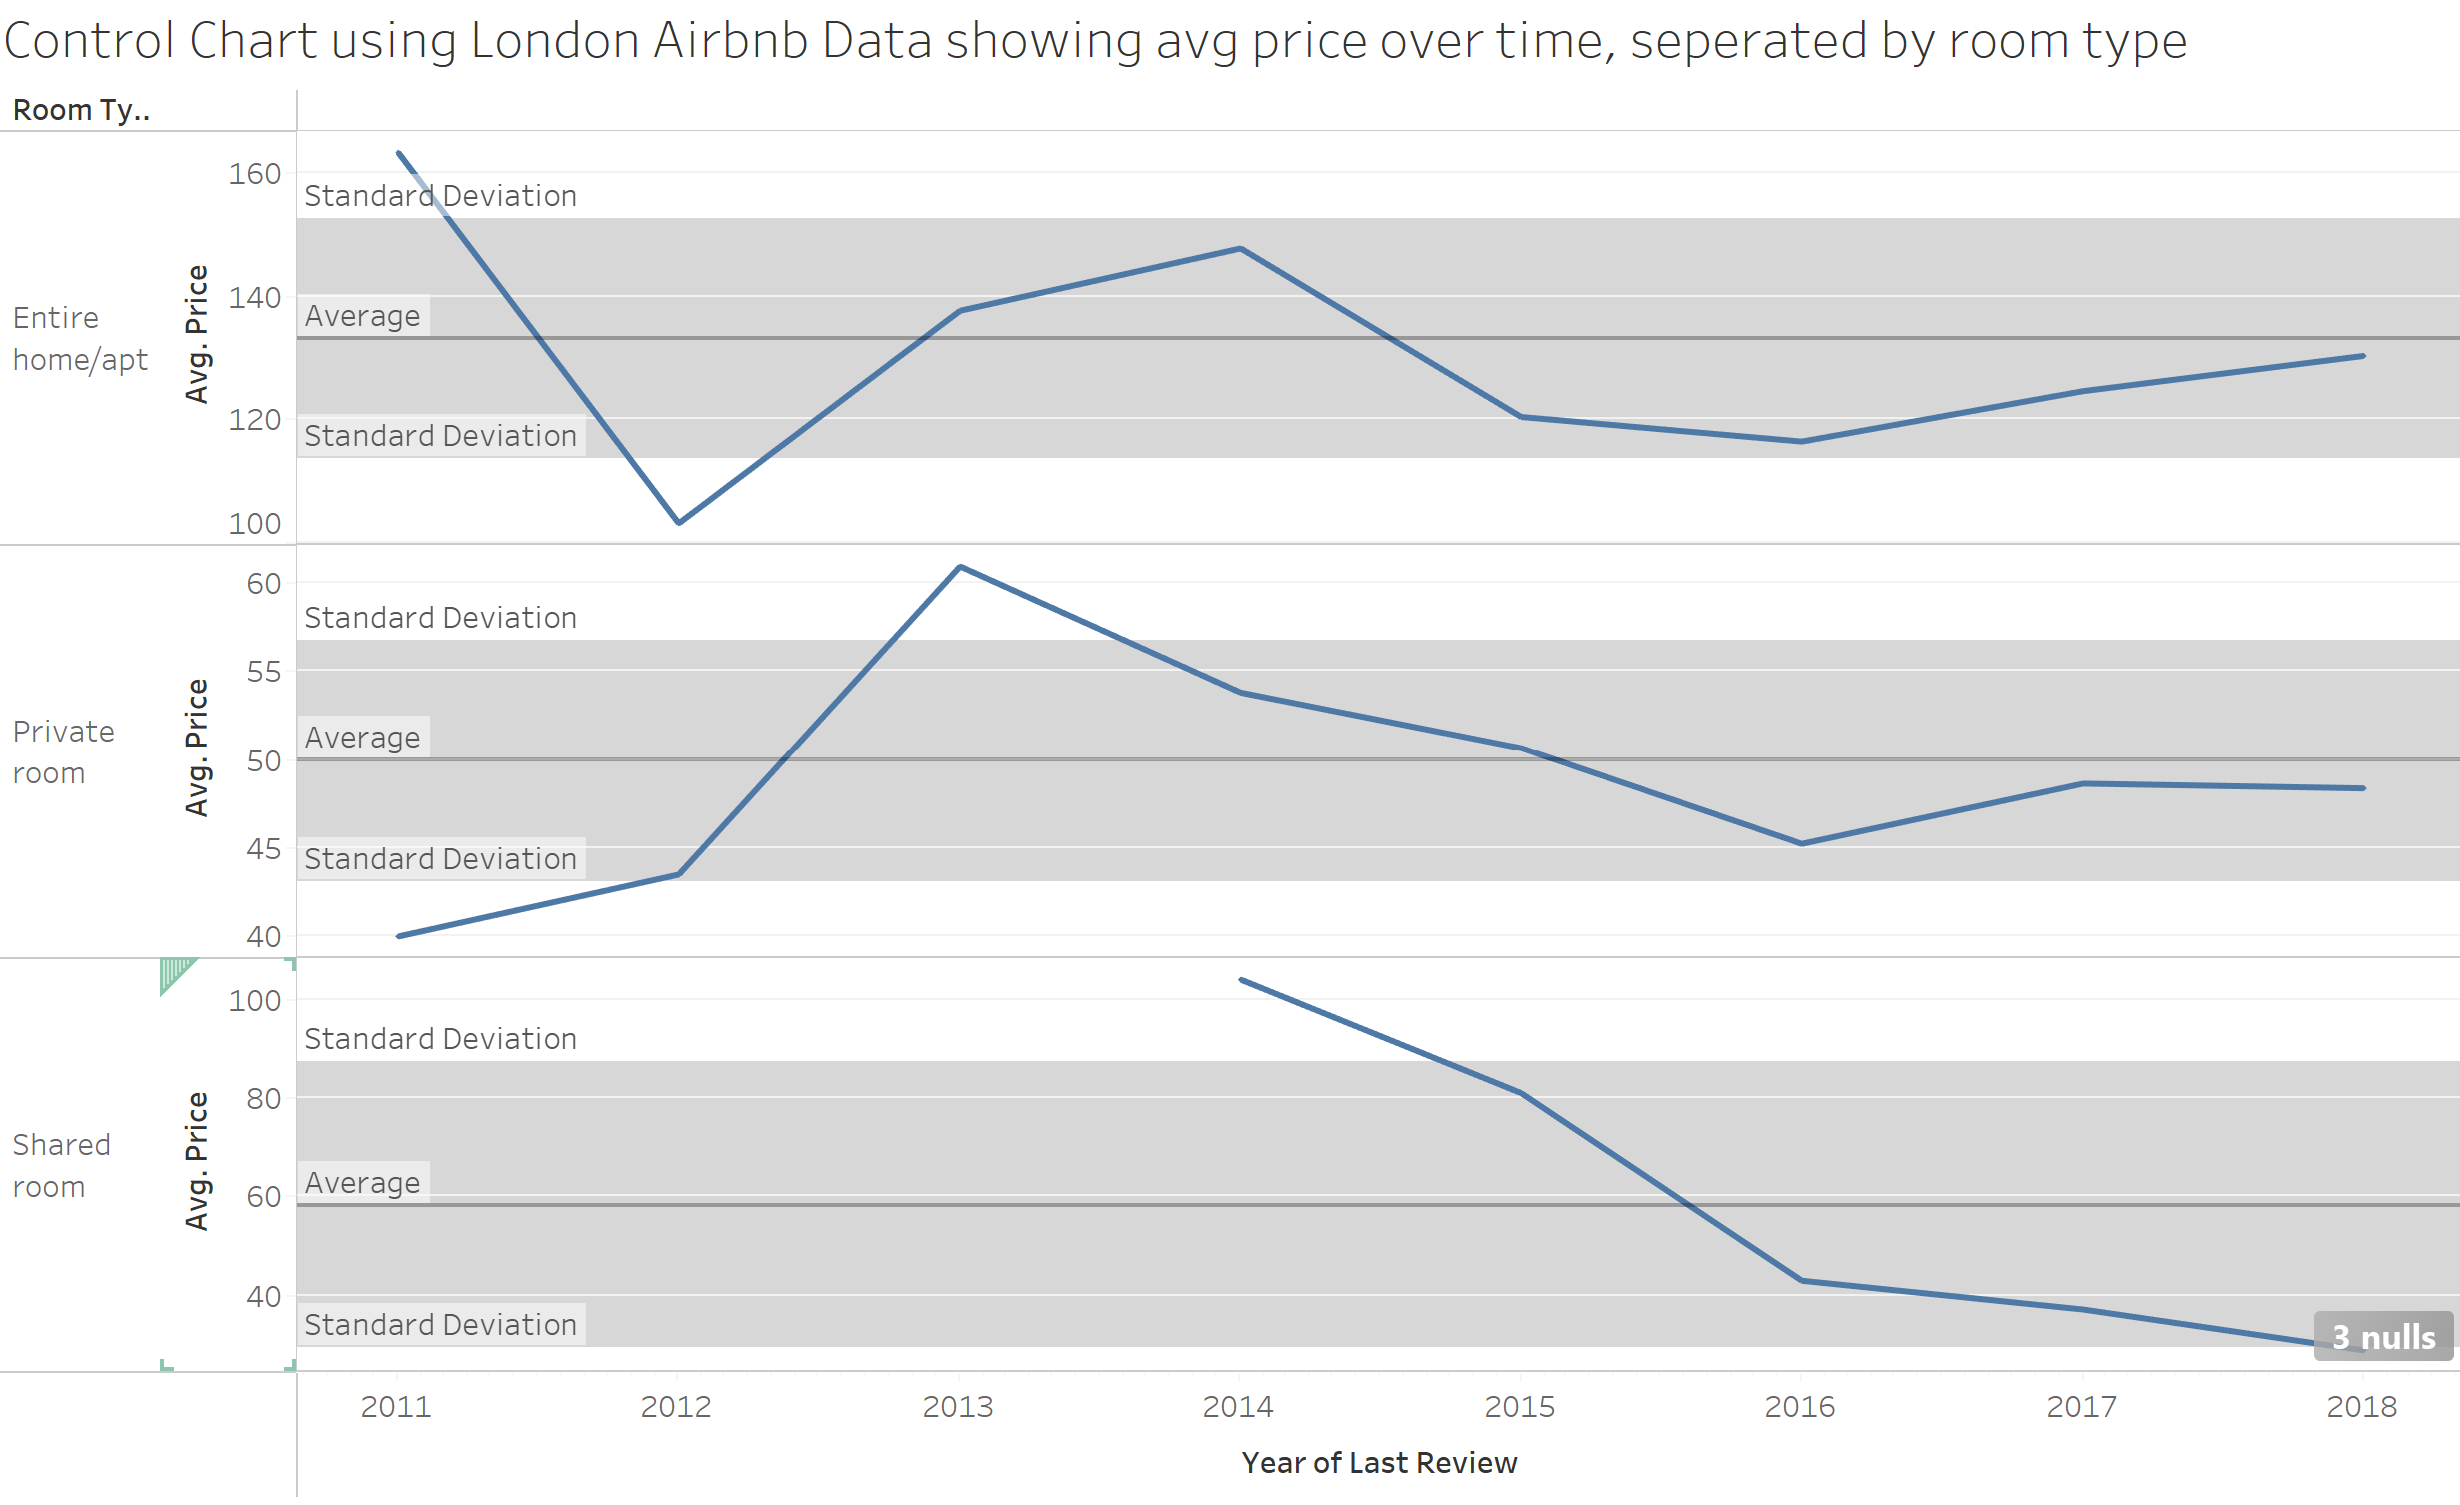
This view is good to go and a simple explanation of how to visualise the standard deviation of London Airbnb prices over time. If you want to challenge yourself, remove the Average band and follow along with below!
Dynamic Standard Deviation
In order to make this dynamic, we need make some calculated fields that we will use in our final visualisation. We also want to add in some more explanation to our chart. We want to show the Maximum and Minimum Standard Deviation of our chart so we can dynamically change to view to show Above and Below our chosen Standard Deviation.
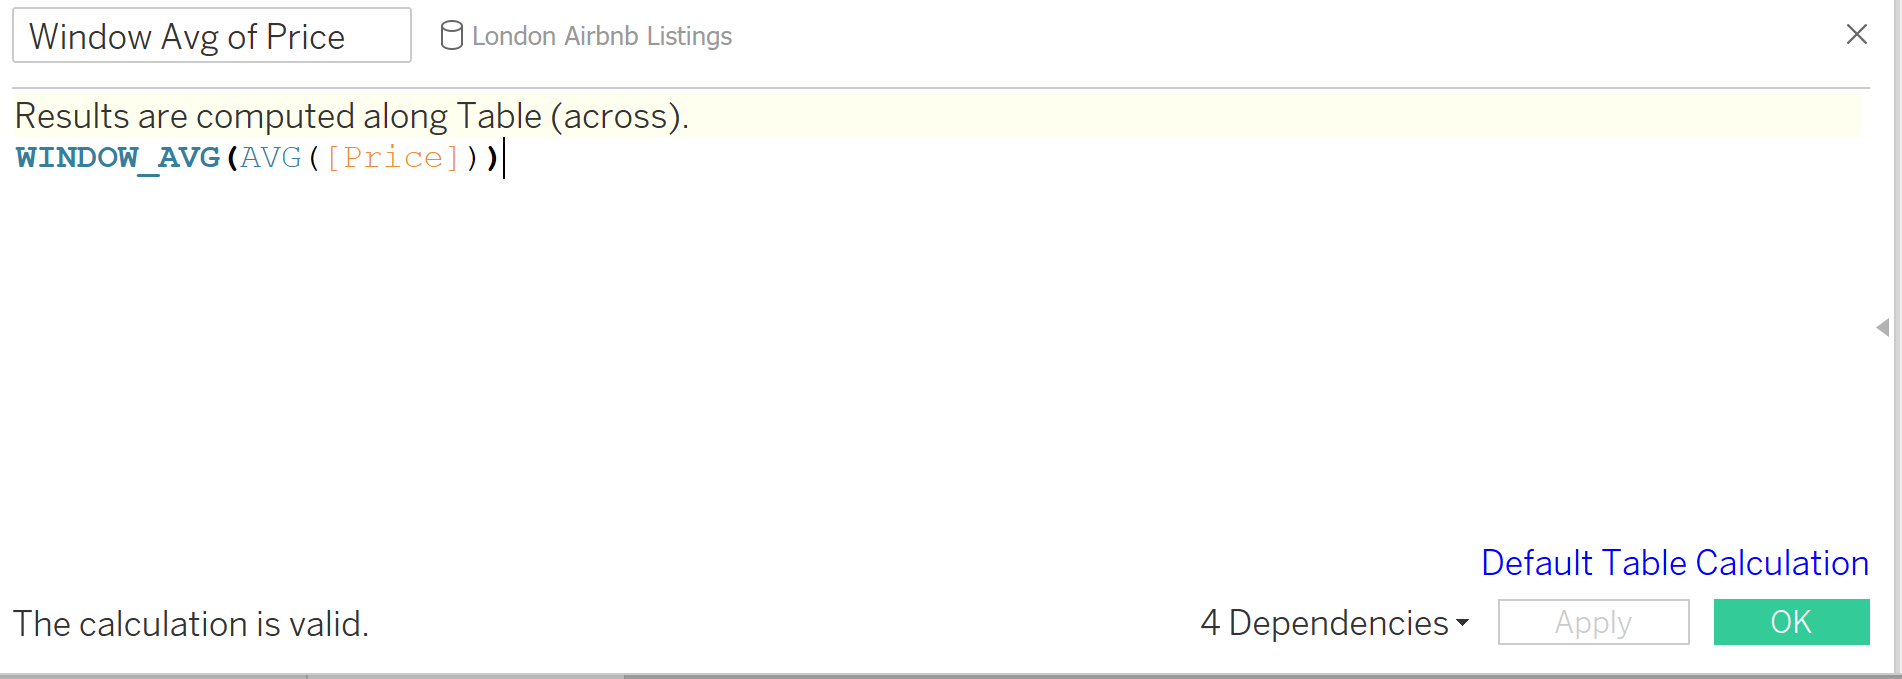
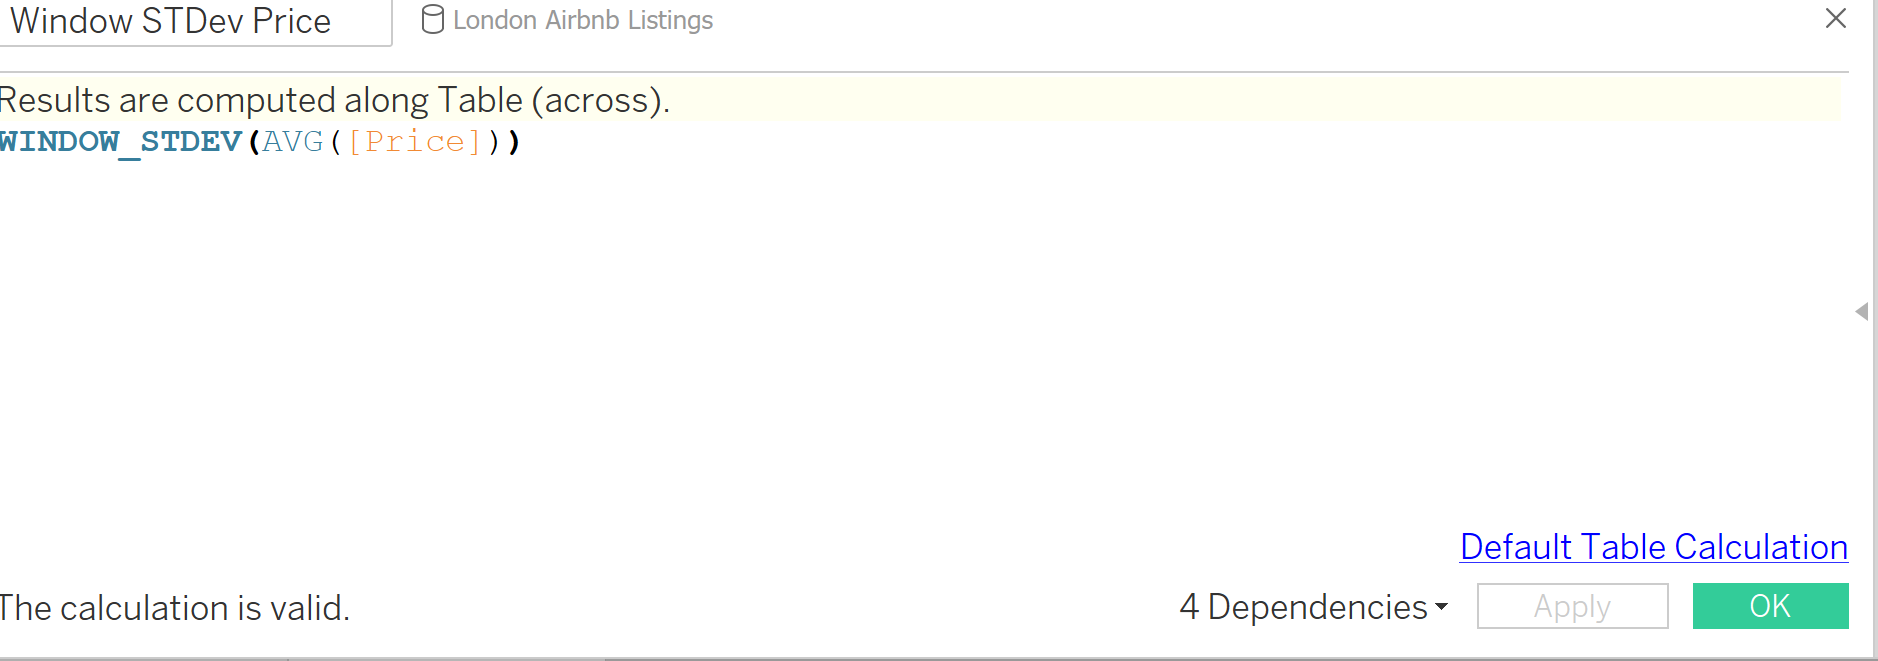
In the previous Static chart, we had the Standard Average across all Room types, but in this view we want this to be true for each of our room types. Therefore, we need to make a Window Average of price and put this on our view. We also need to show the Window Standard Deviation of price so that we can show the the Min and Max. Below you will see the Calcs needed to do this. This is the start of the tricky part!
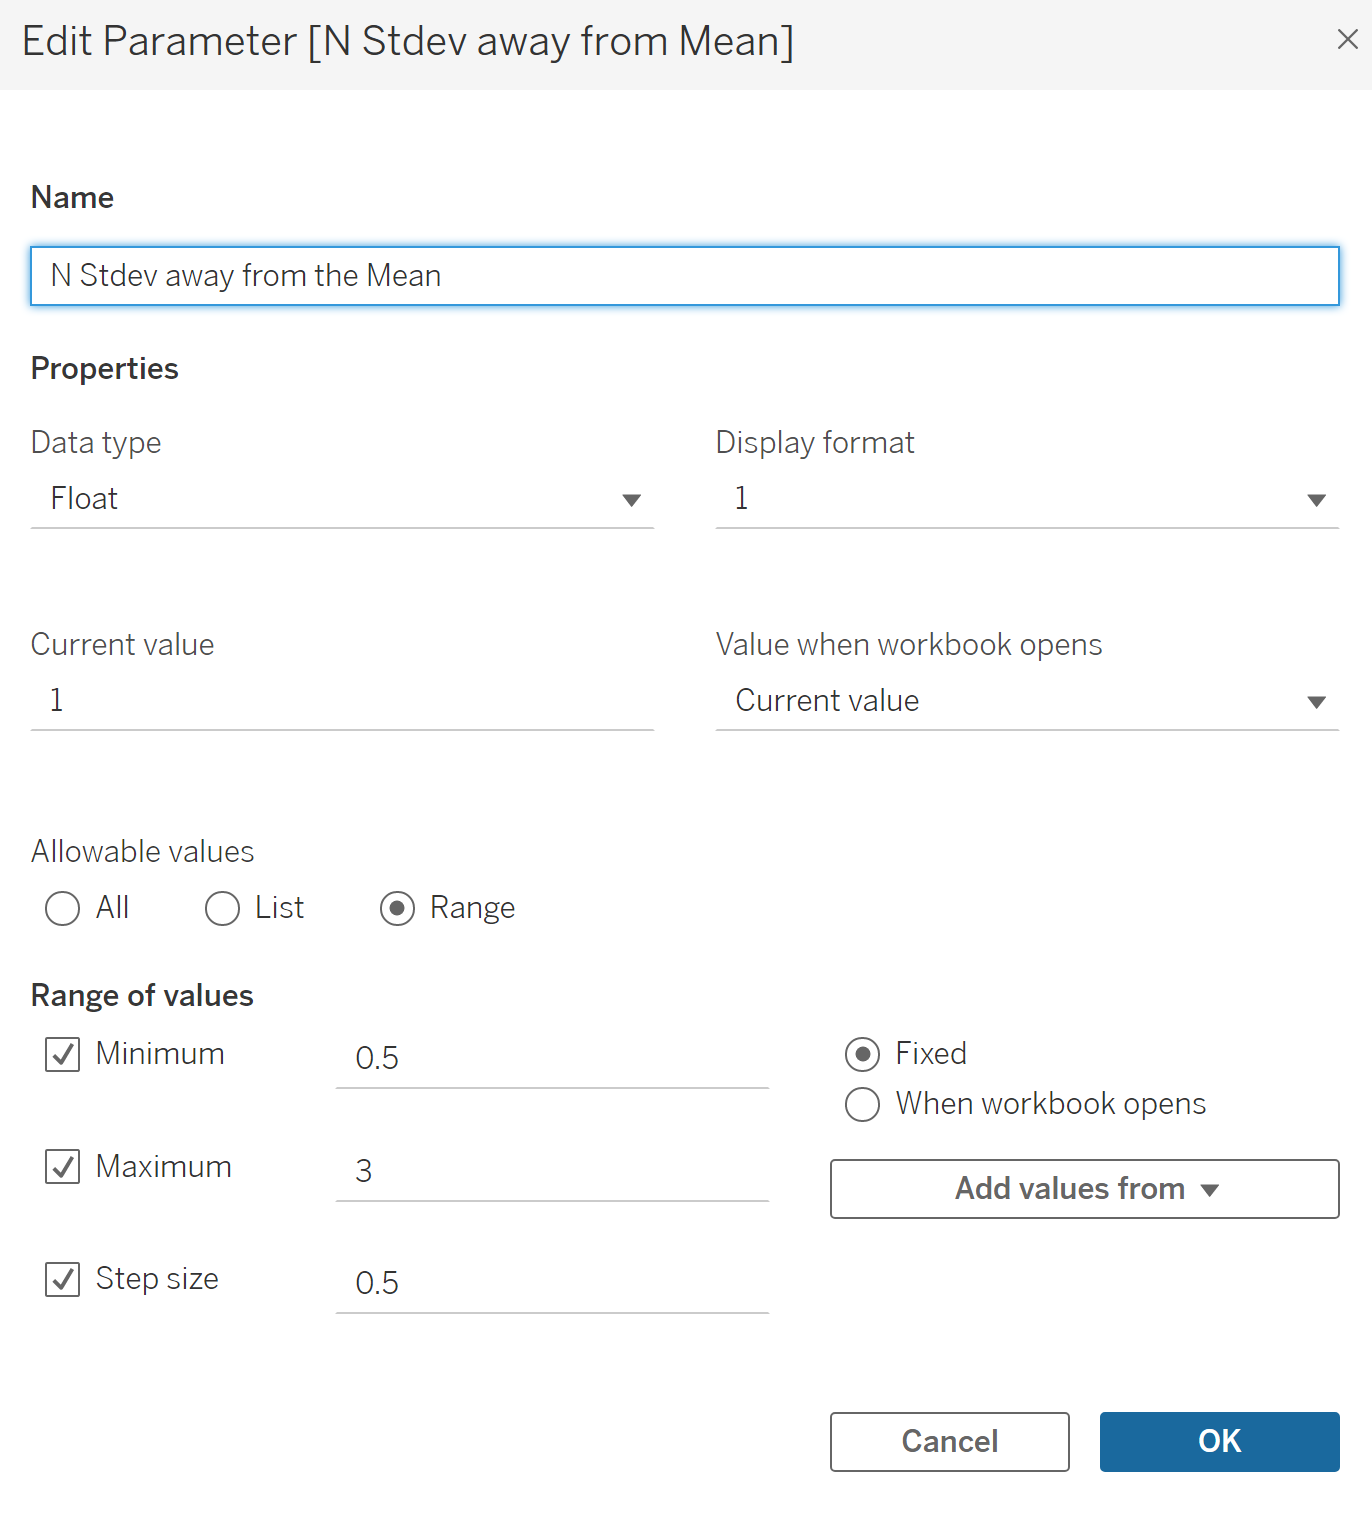
Once these 2 key calcs are made we can go ahead with making our min and max calculations and to do this we need to start with a parameter. I called my 'N Stdev away from the Mean'. (N = the SD chosen by the User)
Once you have the below made you can go ahead and show the parameter.
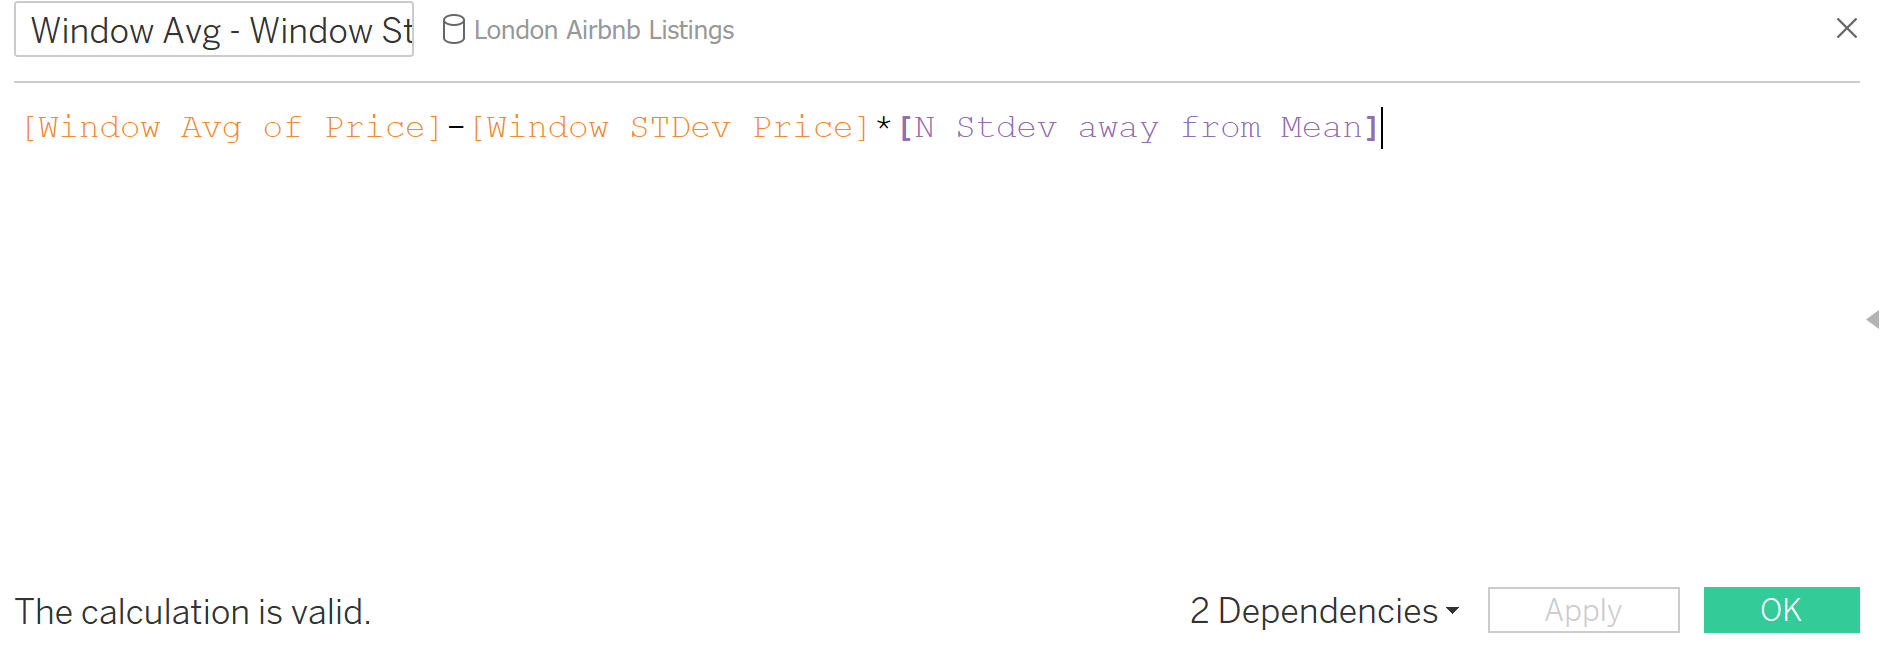
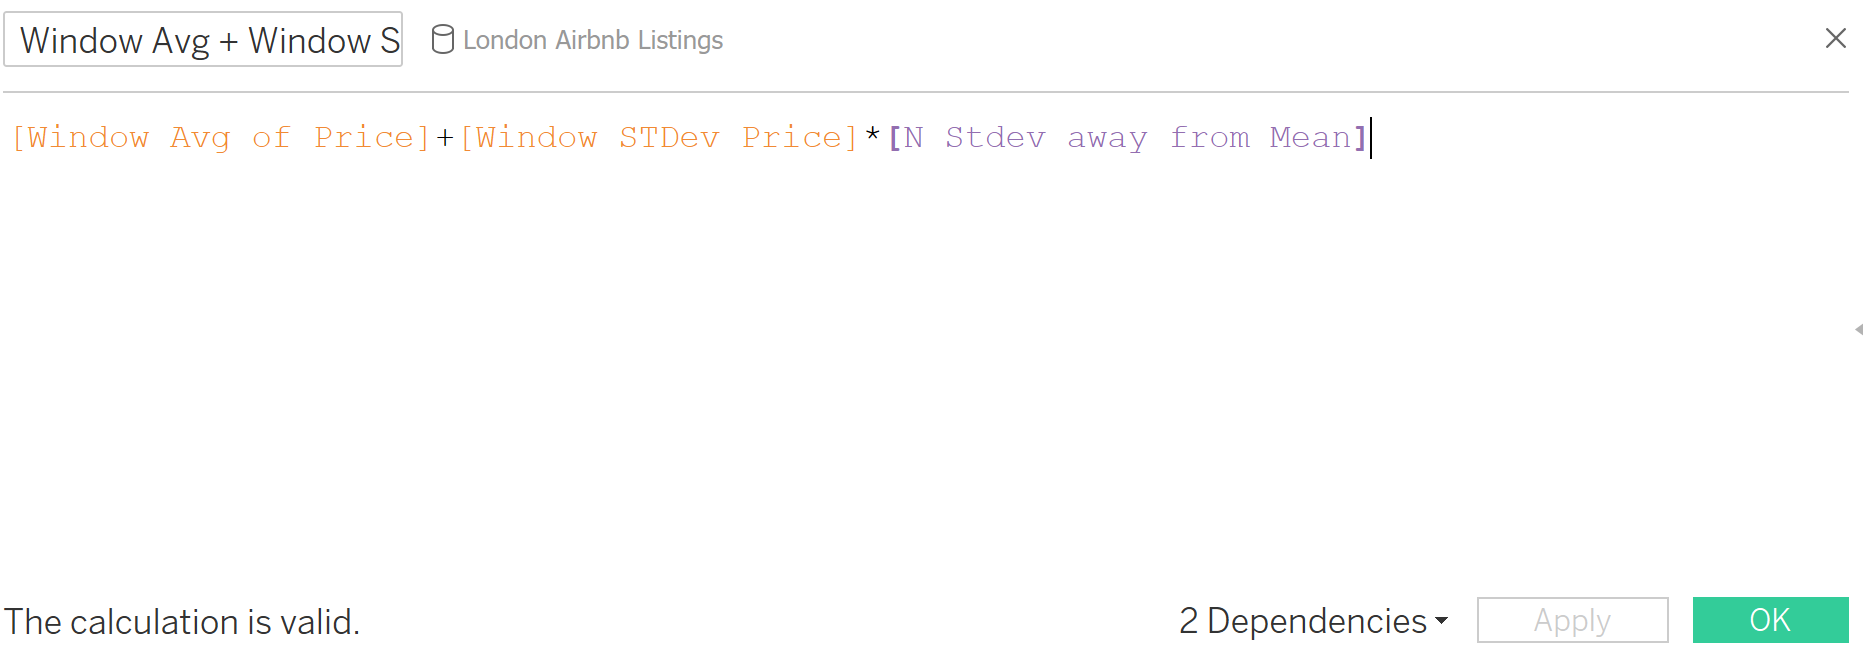
You then need to make 2 separate calculations, one for the Minimum SD and Maximum SD.
The Minimum will be the Window Avg of Price MINUS the Window Stdev Price DIVIDED by our SD Parameter. The Maximum will be Window Avg of Price PLUS the Window Stdev Price DIVIDED by our SD Parameter.
Once these calcs are created, the rest is pretty simple.
First, on our rows shelf we want to duplicate our Avg Price. We then need to dual Axis and change our duplicated Marks card to a circle. We can then Syncronise the axis. Then, we need to show our calcs that we made to show the Window average, Min and Max. On our All marks card, drag in both our Min and Max calculation, along with the Window average calc onto Detail. You wont notice anything straight away, these is because we need to colour each calculation. The best way to do this is, you guessed it, another calculation!
This time we are telling tableau...
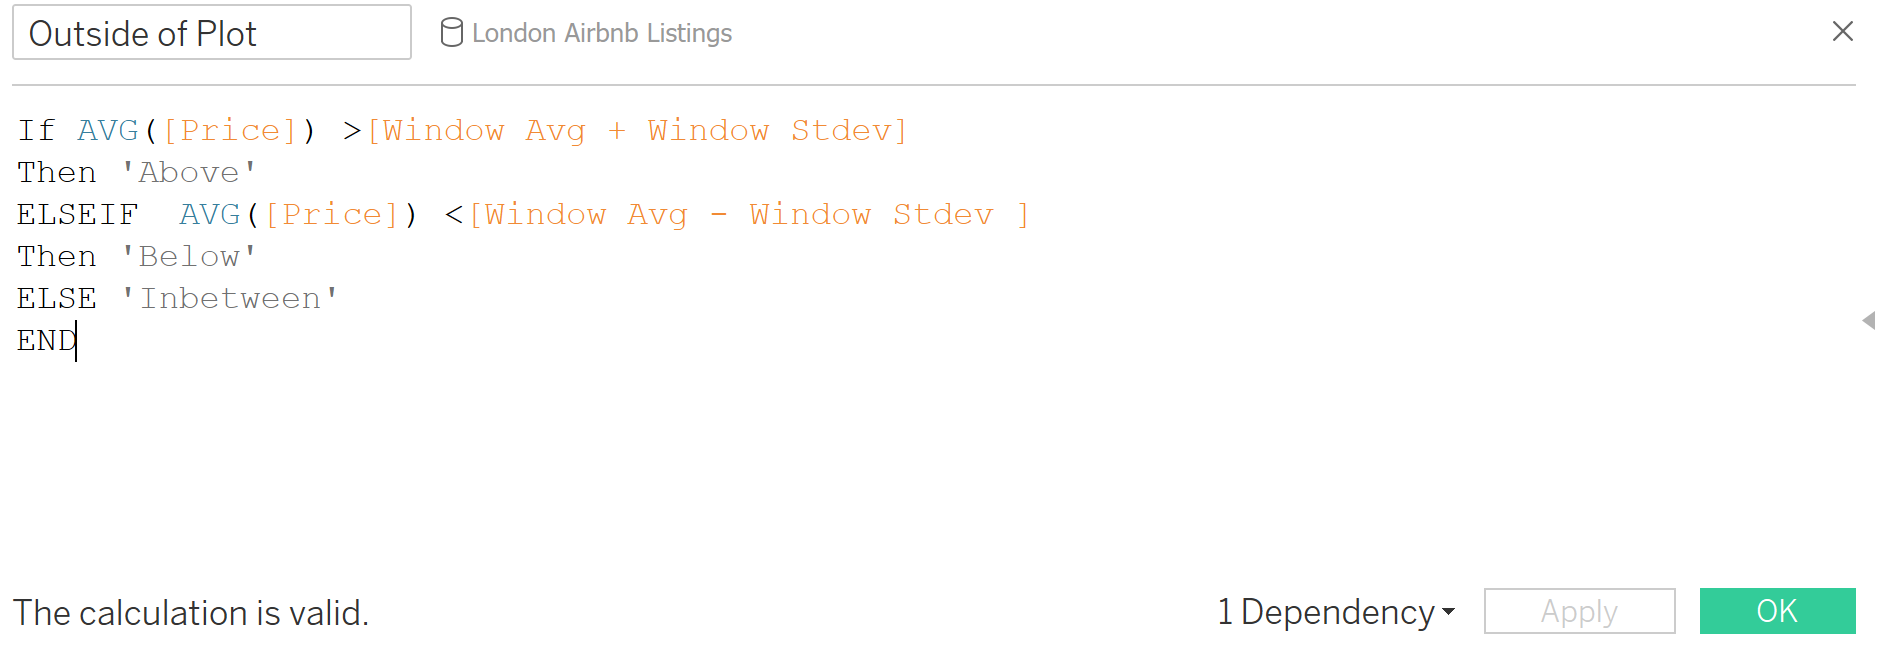
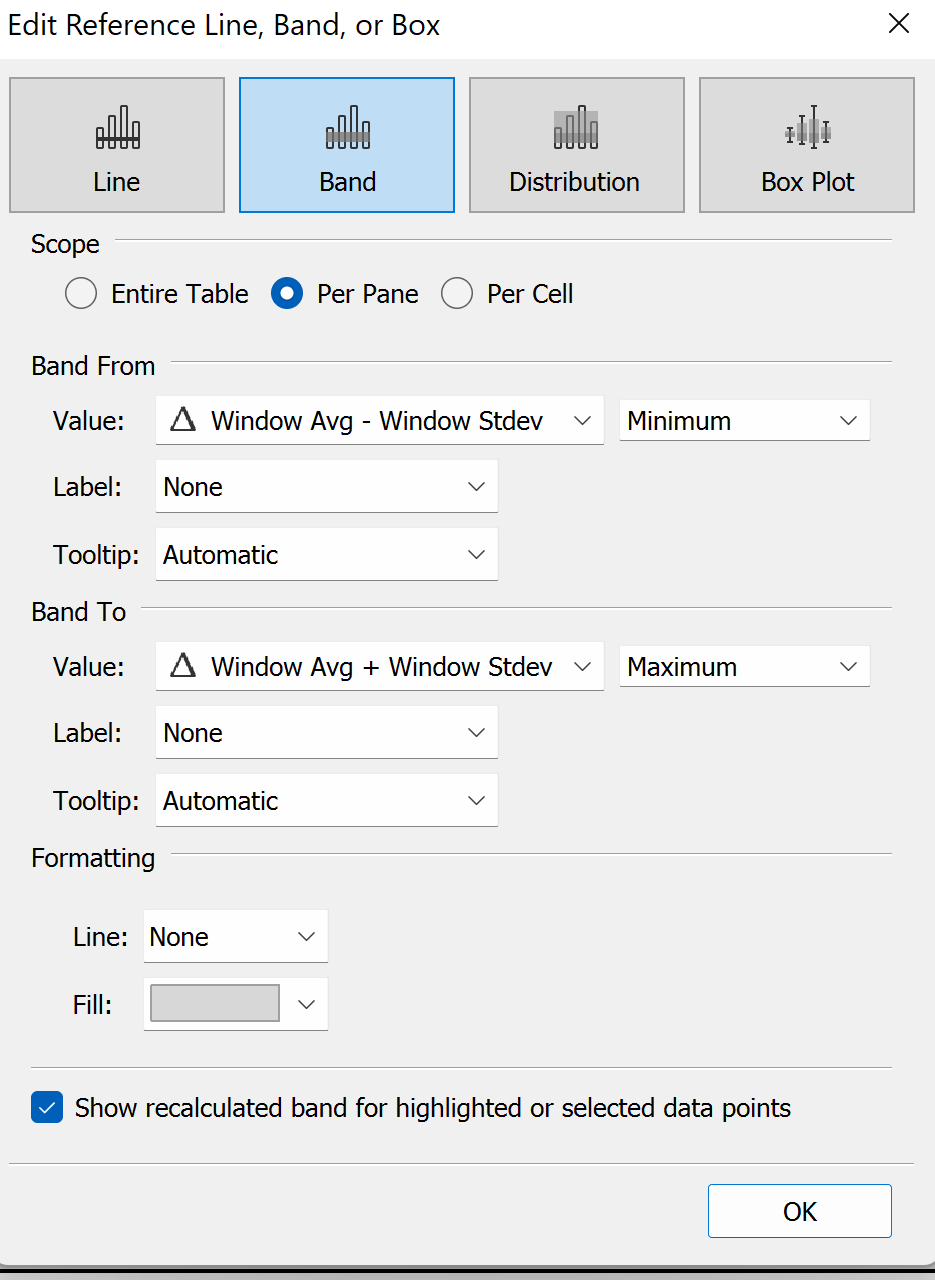
Click apply and drag this onto the Colour Marks card of our duplicated Marks card (which should be circle). You should now start to see the Marks change colour according to their position. Feel free to change the colours to your liking. We also need to change our Distribution band into a just a band and select the configuration seen below.
To see if you calculations have worked, make sure your parameter is shown and change the SD. Now you have a dynamic Control Chart that shows the Average price over time, per room type in London Airbnb's.