


In this blog, I will go through an example of a more complicated way to use Dynamic Zone Visibility.
As I explained in my last blog on this topic, with Dynamic Zone Visibility you can hide or reveal zones based on the value of a field or parameter. As you interact, zones on your dashboard appear or disappear. The result is a dynamic dashboard that doesn’t compromise your desired layout and makes your dashboard clutter free. In simple terms, you can now tidy up your dashboard quicker and easier than ever before - without any hacks!
How do we use it?
To start, you need to make some charts that you will eventually be removing completely from your dashboard, in order to switch with another sheet. Below is an example of how you can use this feature to change between 2 different sheets, completely hiding the other. This is different from the last blog, which used a Boolean to hide one and partially hide the other when selected.
Once you have your charts made and an idea of how you would like your dashboard to be laid out, you can start the process of Dynamic Zone Visibility.
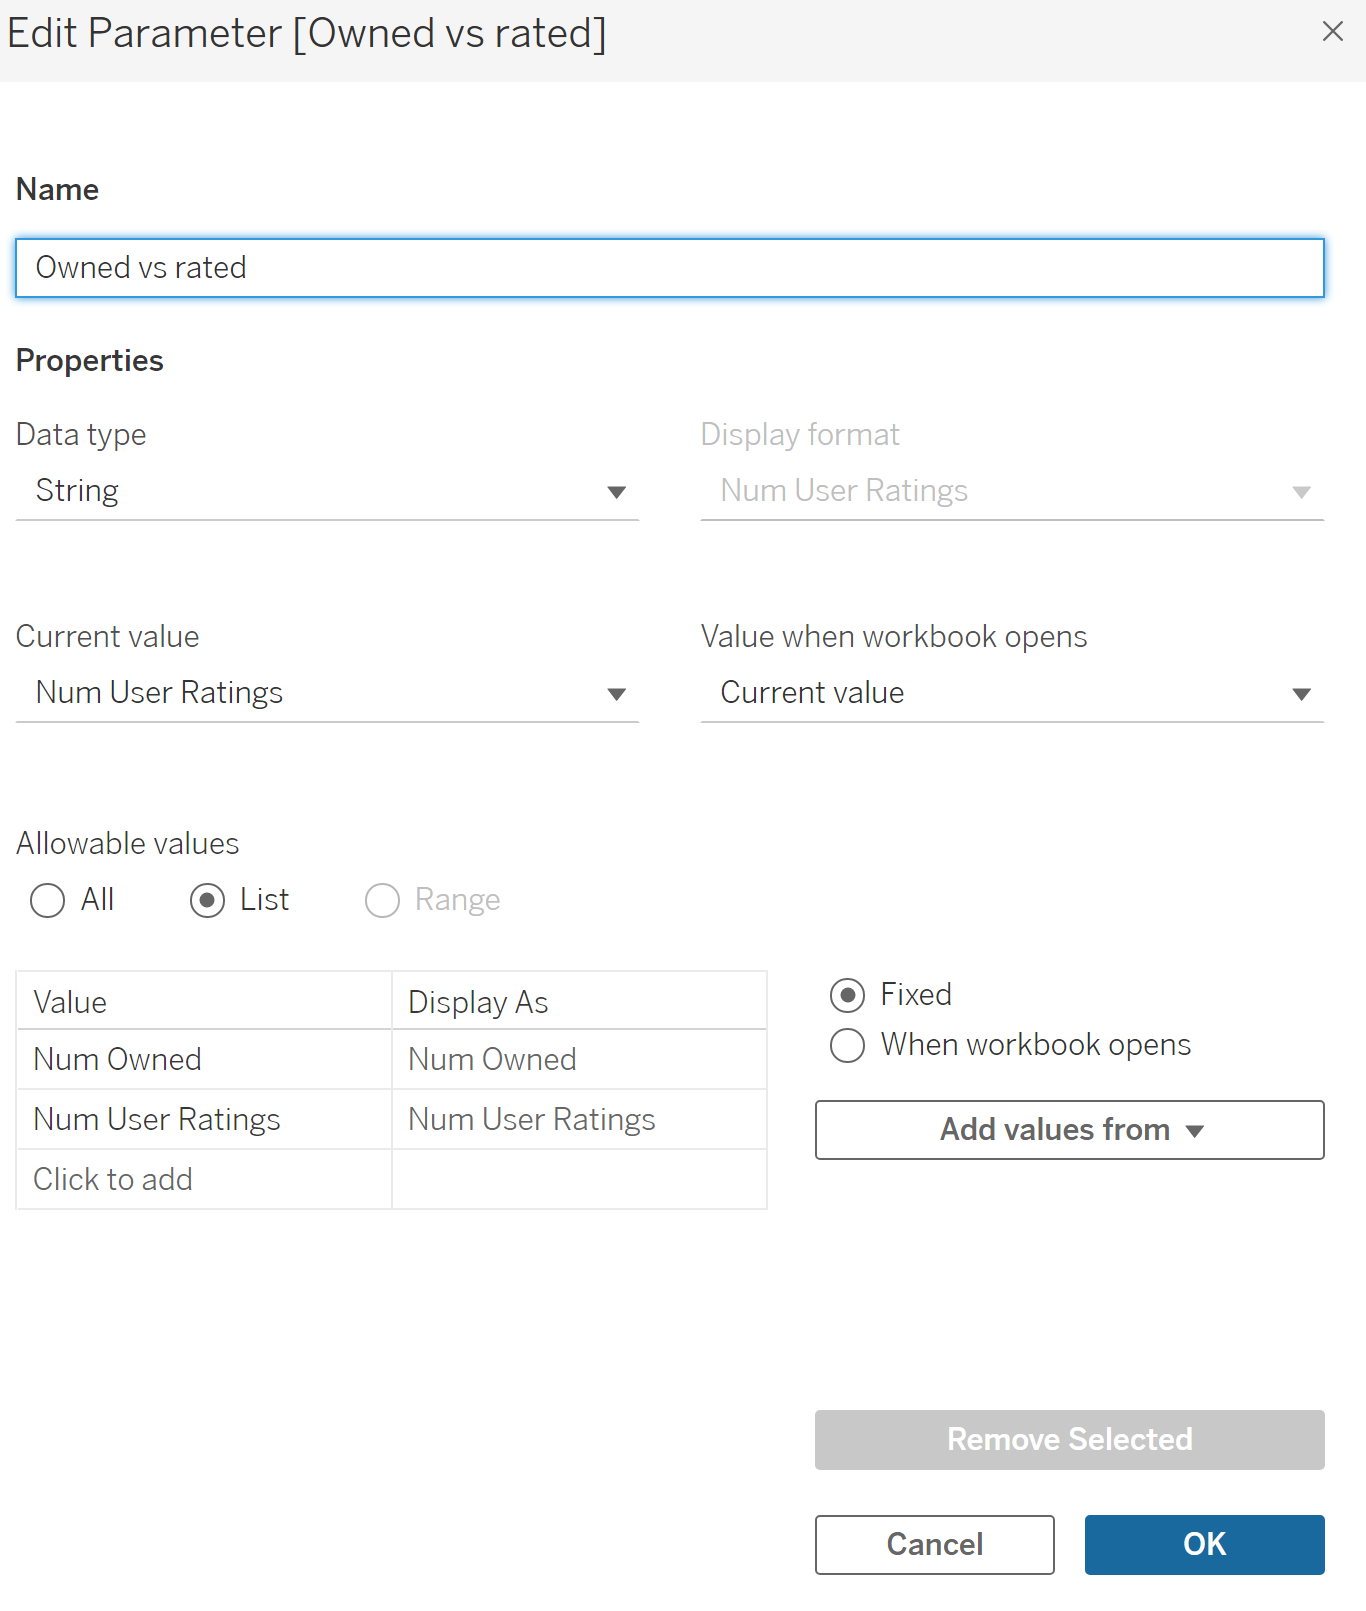
First, you need to make a parameter which will inevitably the filter you use to switch your charts. In this example, I used the fields 'Num Owned' and 'Num User Ratings'.
Once this is made, we need to make calculated fields for both sheets. This is tell tableau which sheet is to be shown when chosen.
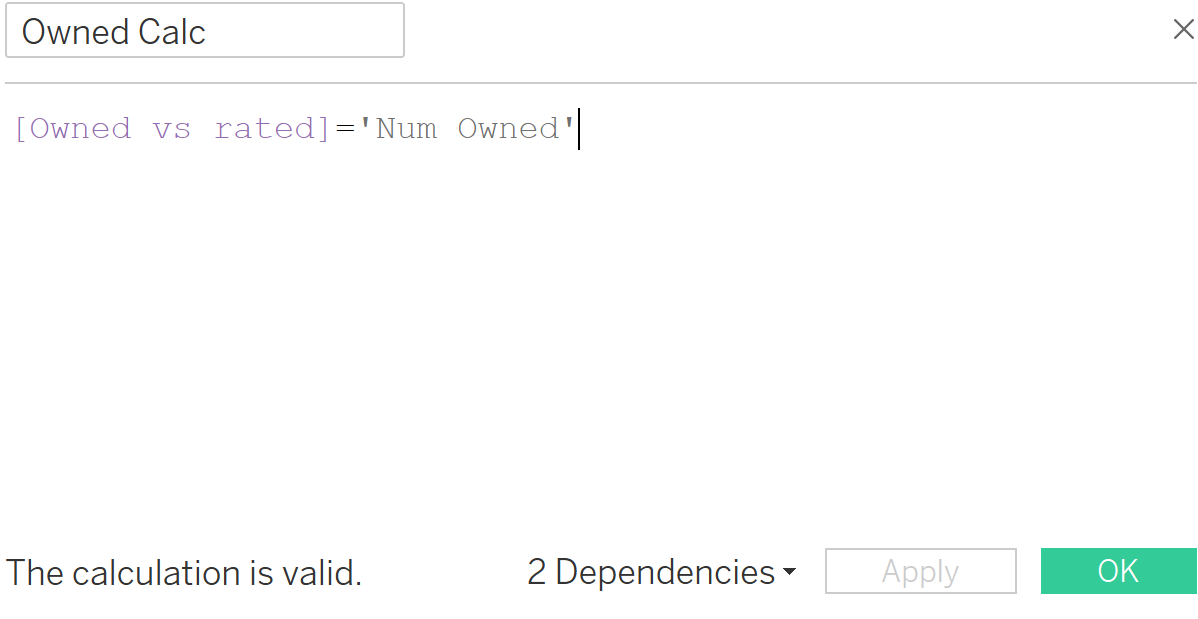
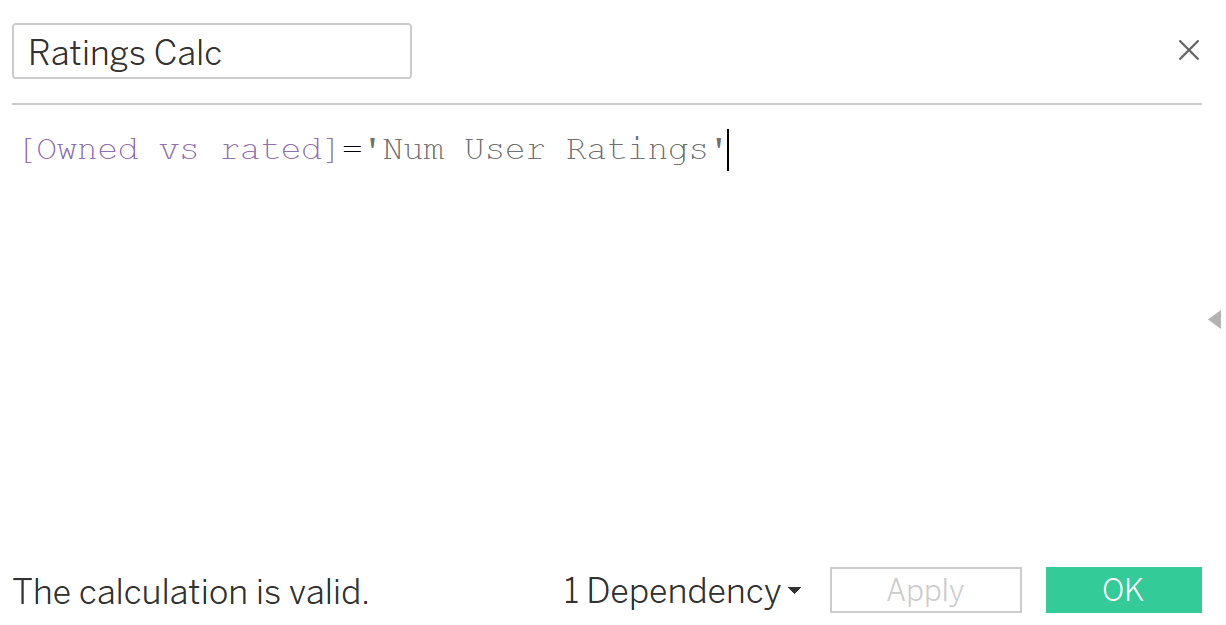
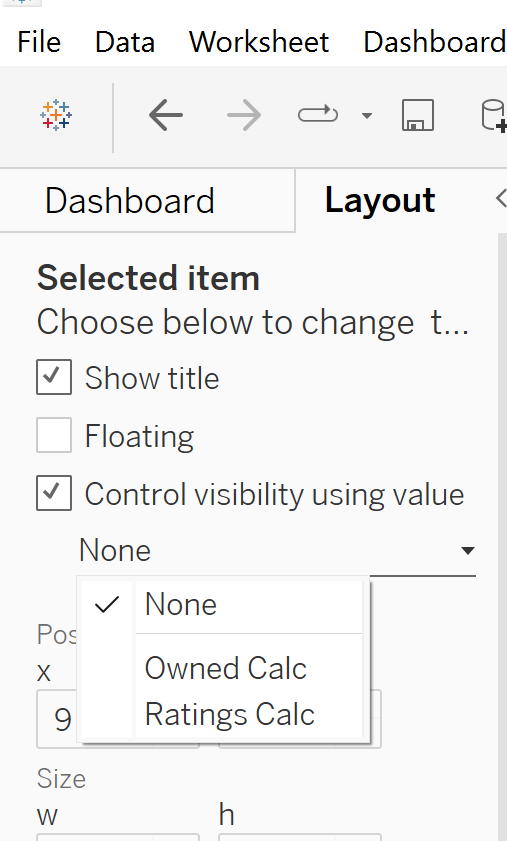
When we have these all created, we can go ahead and put the two sheets we would like to switch onto our dashboard. For the sheet that contained 'Num Owned', we need to tell tableau to show that sheet when selected. to do this we need to navigate to the Layout pane on the dashboard and select 'Control visibility using value'. From here, select 'Owned Calc'. And repeat the process for the other sheet.
Then, we can show the parameter we made earlier, and when you select a sheet, it should hide the other. Feel free to rename your Parameter to make it more user friendly, but thats it! Nice and Simple.
You can also take this further and add in a Parameter Action in order to add in other charts and use those as drivers to switch between charts. This will be in Part 3!