


Today's task was to take one of Season 2's Real World Fake Data and make a dashboard which answers some key questions. We were also tasked with thinking of any additional questions we could answer with the data we have.
I decided to work on the HR Diversity Scorecard which is also a Tableau Accelerator. Right off the back, I really liked the original dashboard and I thought it answered the questions well. I wanted to use it as inspiration but look into the data a bit differently. I knew I wanted to make some charts to see how this fake company hires and how many diverse/POC/female they hire every year. From here I wanted to answer all of the questions that were tasked (similar to the original dashboard) but in a more clear, consise way so that you can get the answers straight away. I also wanted to limit the interactivity to just a year filter so that nothing is lost.
The questions I aimed to answer were:
- How diverse is the organisation, overall?
- What’s the gender distribution in the organisation?
- What percent of the organisation are Persons of Colour?
- How are diverse is the organisation by job level?
- How satisfied are their employees, by demographic?
- How does employee performance compare, across demographics
- Improve the KPIs
To do this I wanted to use a mixture of KPI's, dot plots, Area/line charts and stacked bar charts.
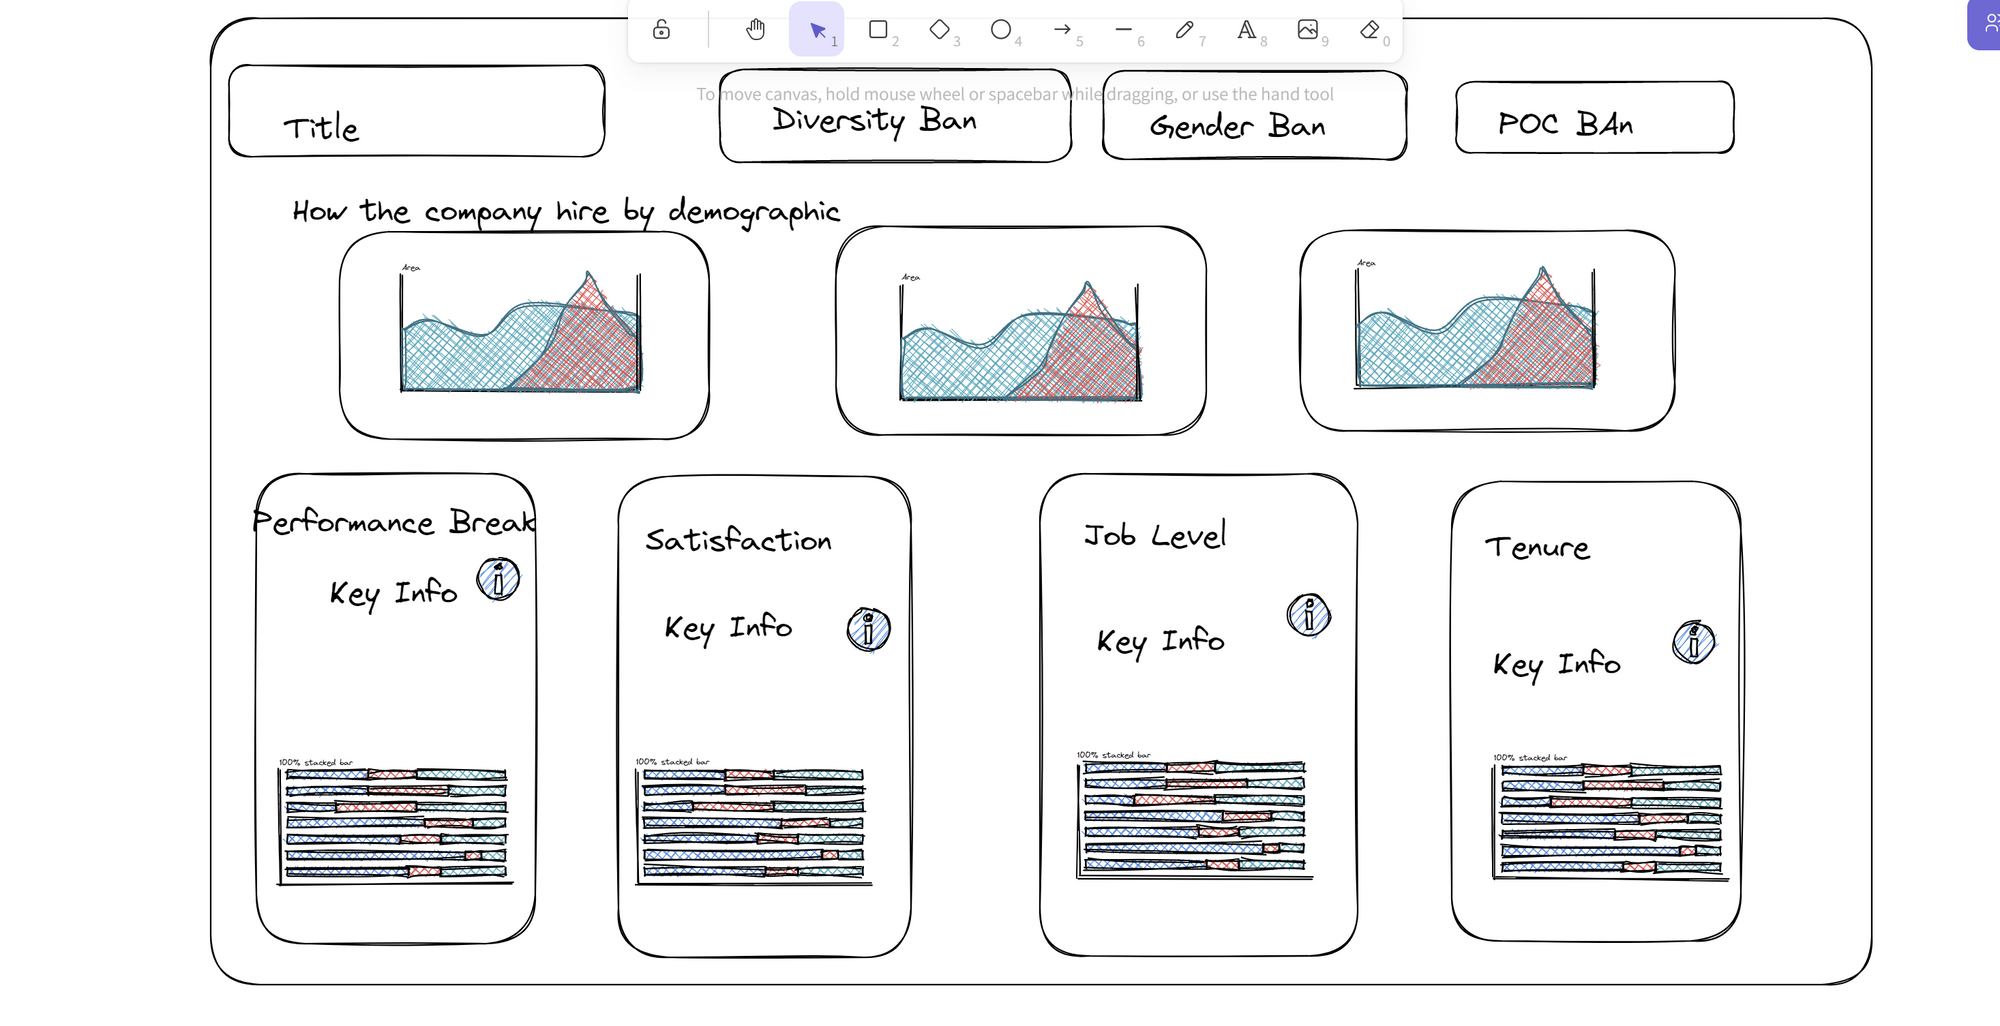
Of course, my original sketch did not turn out to be what my dashboard looked like but it was definitely a start! In the end, I actually kept it very simple and let the charts speak for themselves. I also added in a second dashboard which starts to answer some of the background information I was given. It was interesting to see how each demographic differs when it comes to factors like education, marital status and job types.
The questions I recommend to be answered in the future would be:
- What are the demographics of hiring managers?
- Why are non female and non poc staff members happier in their jobs?
- Why are more diverse staff members scored poorly in performance?
- Do background factors such as education and martial status affect job types?