


Today we were tasking with looking at data from the website Basketball Reference. We could either choose to go very specific or show more of an overview of our chosen data. I chose to go kind of specific and focus on how player salaries affect their game day performance. I was a bit skeptical of today as I have not had much practice with Power BI but I was excited to see what I could come up with.
Requirements:
- Use Power BI to bring in the data tables from the Basketball Reference Teams Page
- Must use years from 2002 to 2022. But can choose what teams and/or divisions to use.
I chose to focus on the Boston Celtics ( I'm Irish, I had to!). To start, we needed to choose which years of data to scrape from the website. We were originally tasked with imputing 20 different years into Power BI but this proved a difficult challenge in the allotted time so I focused on the last 5 years - 2018 to 2022. The data itself was clean enough but I must admit I am a bit clueless when it comes to basketball so some of the terms seemed a bit alien to me. My main challenge was combining all the years together. This proved difficult as I merged incorrectly the first time and had to start over once I realised!
At the start of the day I tried my best to input 20 different URLs but with multiple tables per sheet it was proving super difficult to do. I started to manipulate the HTML but it was taking a long time and slowing my laptop so I made the decision to input 5 years manually and focus on 3 tables from each year. This still took a lot of time but I learned my lesson from yesterday about being stubborn and trying to fix a problem that is too much for a few hours.
I knew straight away that I wanted to focus on salaries and I drew a quick sketch of my idea.
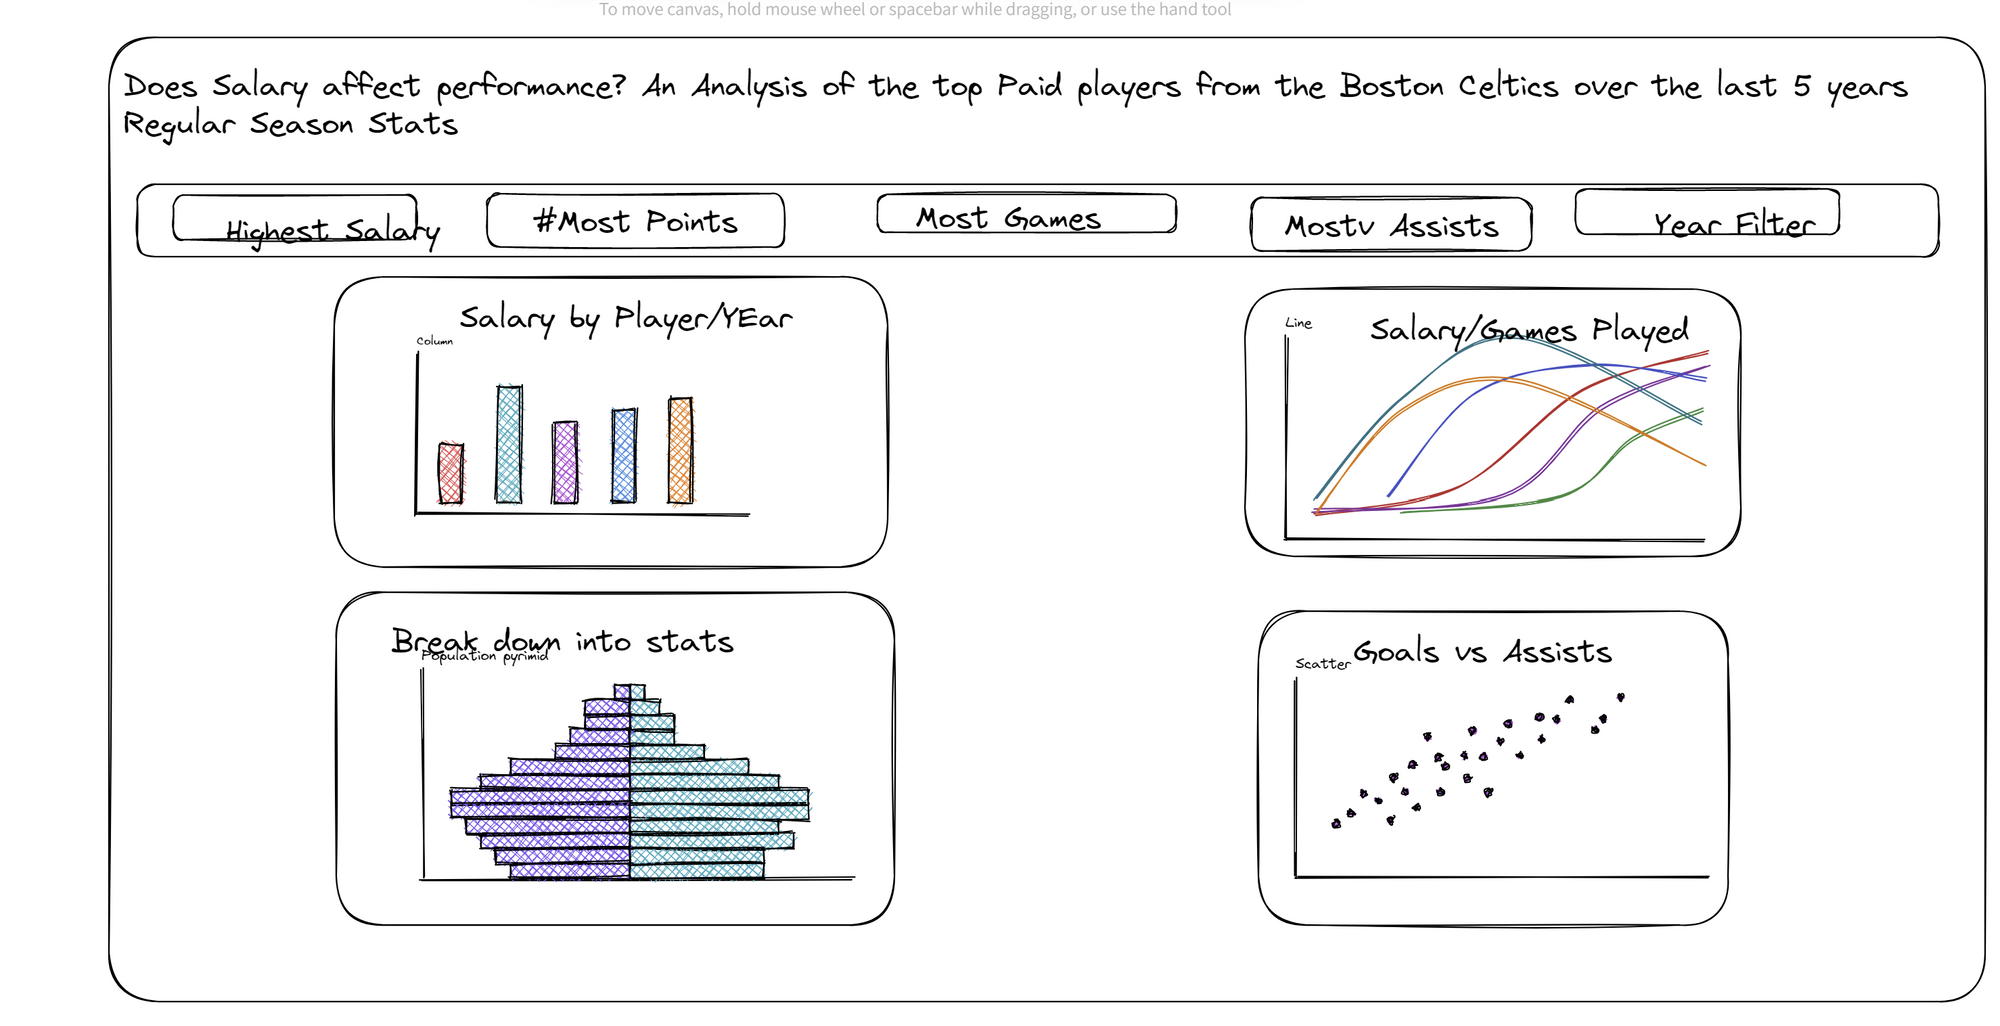
This later changed slightly due to my unfamiliarity with Power BI. My approach was to keep it simple and straightforward in order to quickly answer the question I aimed to answer. Overall, I am happy that I managed to put together a dashboard that shows that the players who get paid the most, do in fact play the best! Who would have thought. I guess I am used to mediocre footballers getting paid millions to sit on the bench :)