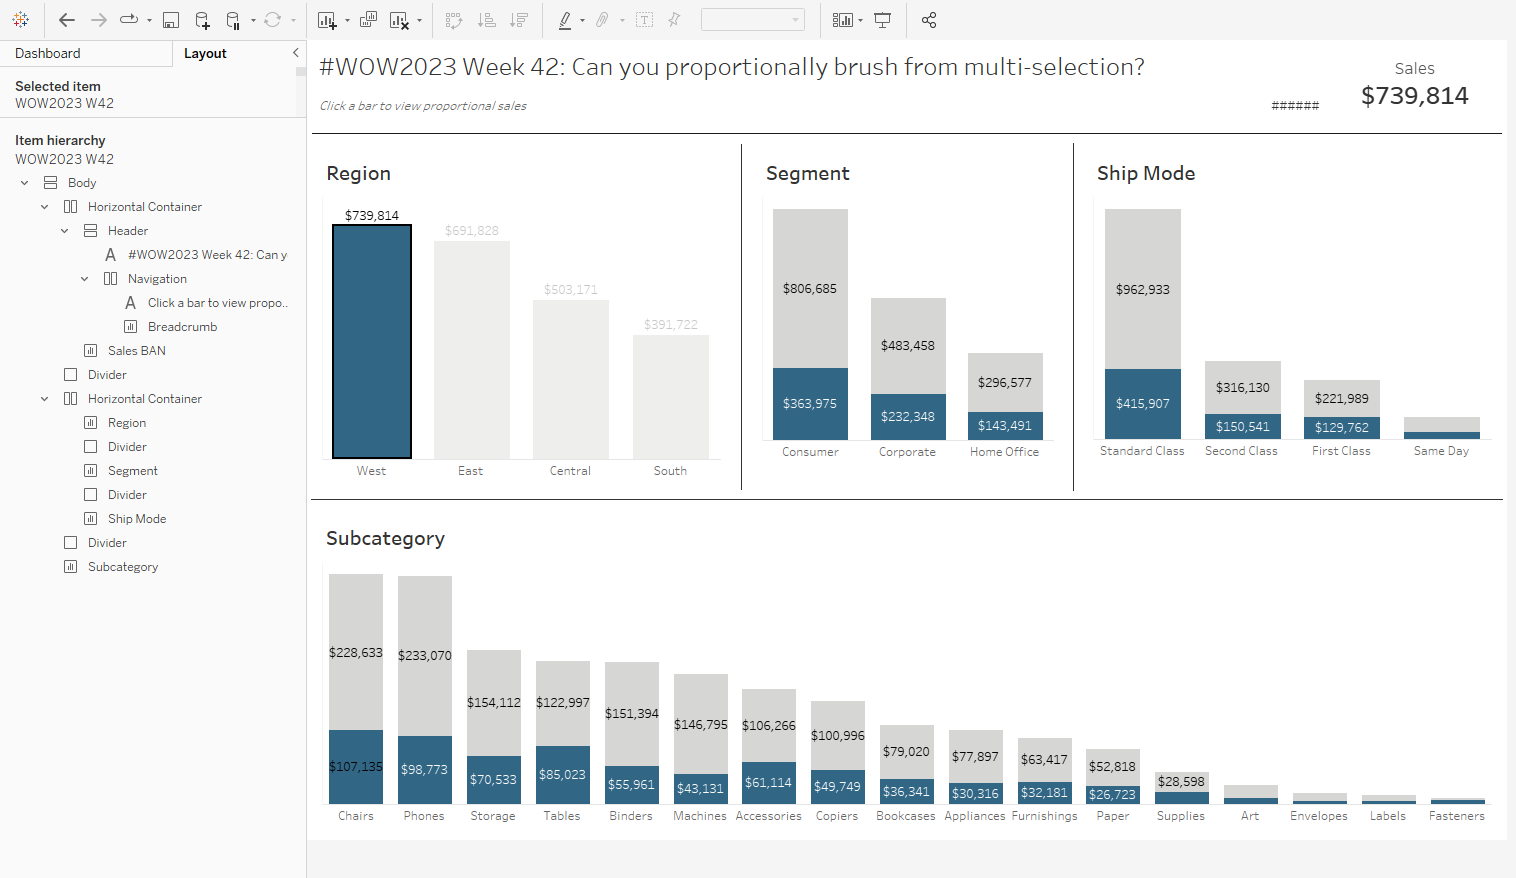
This Workout Wednesday was created by Kyle Yetter to practice multi-selection features. Similar to Kyle, I have worked on projects where the client wants to engage with a combination of fields to gain insights to a specific customer segment. Proportional brushing can serve as an alternative to fiddling with filters to control multiple charts.
To solve this Workout Wednesday, I started by creating a big aggregated number (BAN) for sales and building the bar charts for Region, Segment, Ship Mode, and Sub-Category.
1. Create Dimension Sets
Now, to create the sets for each dimension.

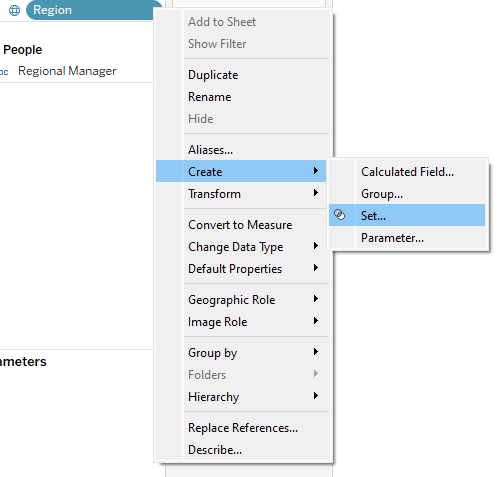
Right-click on each dimension to create a set and show the set for testing.

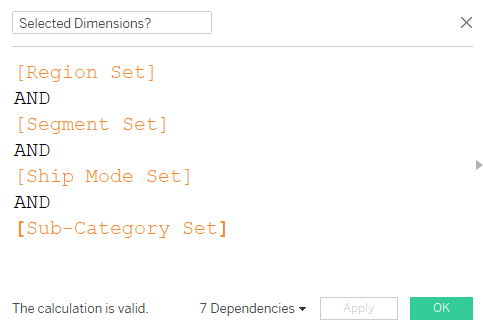
To brush the bars in blue, I created a single calculation that tests if the row value is in every set.
NOTE: You can combine sets in Tableau, but only if the sets are based on the same dimension. Since we are using multiple dimensions, we have to use sets in calculated fields.
2. Sets to Color Marks
Selected Dimensions? is then used to color marks. At this step, I could build out most of the dashboard.

3. Breadcrumb Calculation
What is a set?
The last step is adding breadcrumbs to show what has been filtered. Start by understanding that Tableau Sets hold two values:
- In/Out
- All values in the set
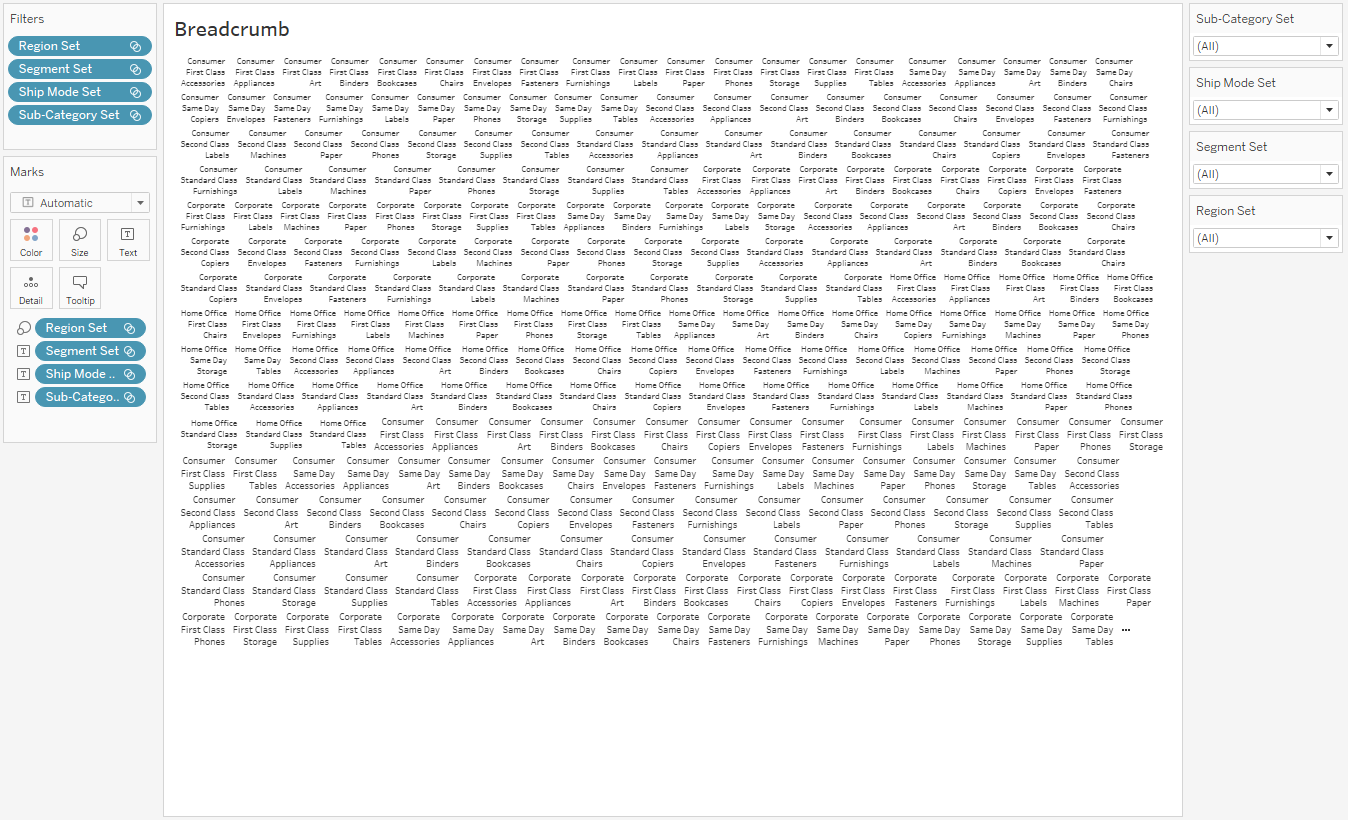
First, try using the set values as text in the view. This produced a wall of text which should show “All Segmentation” when all set values are selected, like below.

Test if any values are selected by counting the number of Boolean values available in the set: COUNTD(Selected Dimensions?). This equals two when we select values to be Inand Out of the set. We can use this logic to test if something has been selected and who the set values.

Simply setting the count test then showing the set values does not work. If you use an aggregate once in a conditional statement, then you have to use it throughout the entire statement. We can fix this using an Level of Detail Calculation so Tableau reads a single value from an aggregate. Here is the proper calculation with curly brackets: IF { COUNTD(Region Set) } = 2 then '>' + [Region] ELSE '' END
Continue to build out this expression for each dimension set within one calculation.
Conditional Logic
The order from the WOW requirements is Segment>Ship Mode>Region>Sub-Category.
- If a Segment is selected then show the selected Segment.
- If a Ship Mode is selected then show the Segment and Ship Mode.
- If a Region is selected then show the Segment, Ship Mode, and Region
- If a Sub-Category is selected then show the Segment, Ship Mode, Region and Sub-Category.
If any of these dimensions do not have selections, then the output should be blank. When no values are selected then it should display ‘All Segmentation.’
We can use as shorthand conditional statement to achieve this: IFF(TEST, TRUE output, FALSE output) .
// Add [Selected Dimensions?] Filter
IIF( { COUNTD([Segment Set]) }=2 , [Segment], '')
+
IIF( { COUNTD([Ship Mode Set]) }=2,
    // Segment>Ship Mode
    IIF( { COUNTD([Segment Set]) }=2 , '>' + [Ship Mode], [Ship Mode]), '')
+
IIF( { COUNTD([Region Set]) }=2,
    // Segment>Ship Mode>Region
    IIF( { COUNTD([Segment Set]) }=2 OR { COUNTD([Ship Mode Set]) }=2, '>' + [Region], Region), '')
+
IIF( { COUNTD([Sub-Category Set]) }=2,
    // Segment>Ship Mode>Region>SubCat
    IIF( { COUNTD([Segment Set]) }=2 OR { COUNTD([Ship Mode Set]) }=2 OR { COUNTD([Region Set]) }=2, '>' + [Sub-Category], [Sub-Category]),
    // All Segmentation
    IIF( { COUNTD([Segment Set]) }=2 OR { COUNTD([Ship Mode Set]) }=2 OR { COUNTD([Region Set]) }=2 OR { COUNTD([Sub-Category Set]) }=2, '', 'All Segmentation'))
If you run into any errors, check that you are using set values in the `COUNTD()` function and the dimension field for outputs. Or, you can check out my solution here.
