Tableau Pulse insights are enhanced by AI. But, is your data ready for Tableau AI? In this post, I’ll share tips and Tableau Prep steps for Tableau Pulse Metrics.
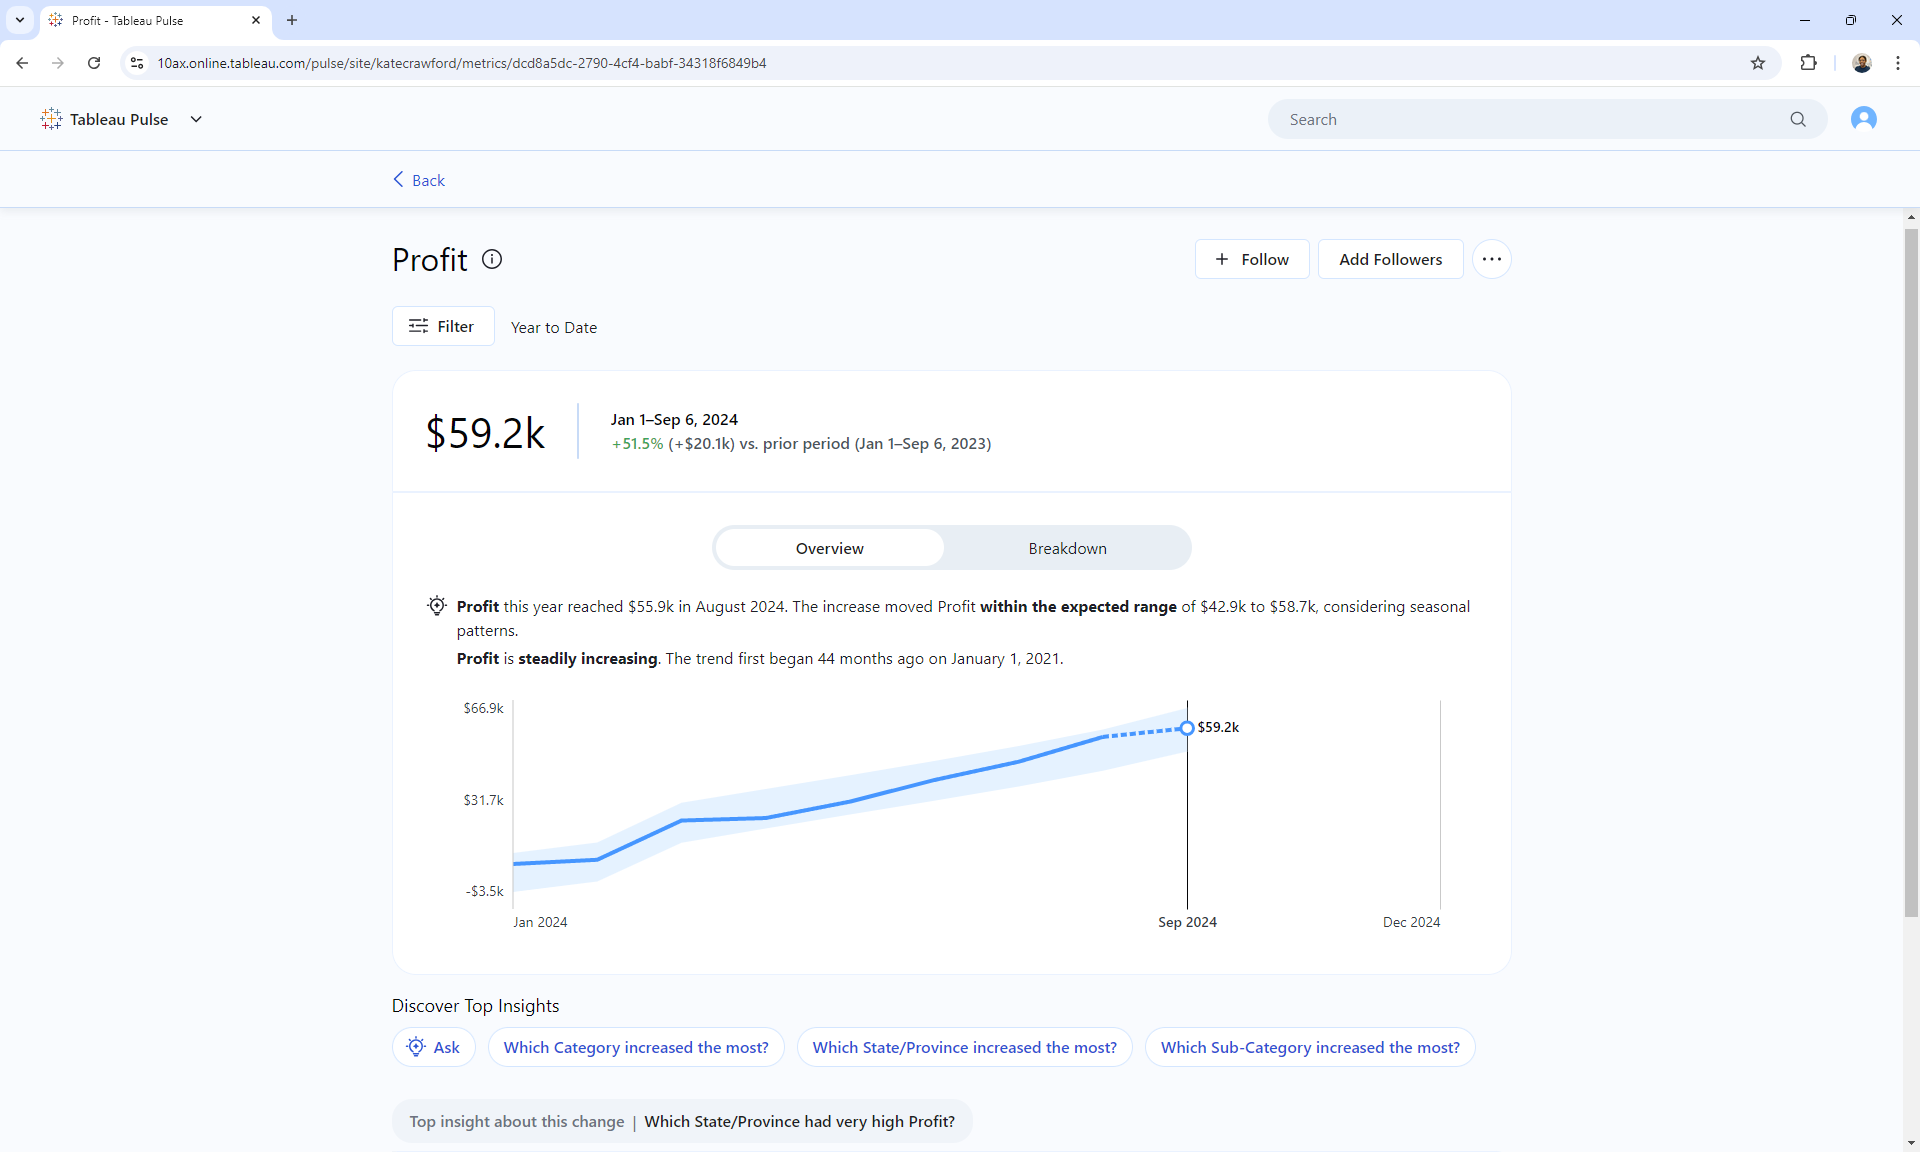
What is Tableau Pulse?
Tableau Pulse is a data interface available on Tableau Cloud. Through guided questions with Tableau AI, anyone in your business can quickly generate visualizations and explore trends and changes to your data.
Follow metrics and create new ones from data already in your cloud environment. Go mobile with Pulse Digests, which are scheduled summaries sent via Slack, Email, or the Tableau Mobile App.
What is a Tableau Pulse Metric?
Metrics are defined by one measure, one time dimension, and multiple categorical breakdowns.
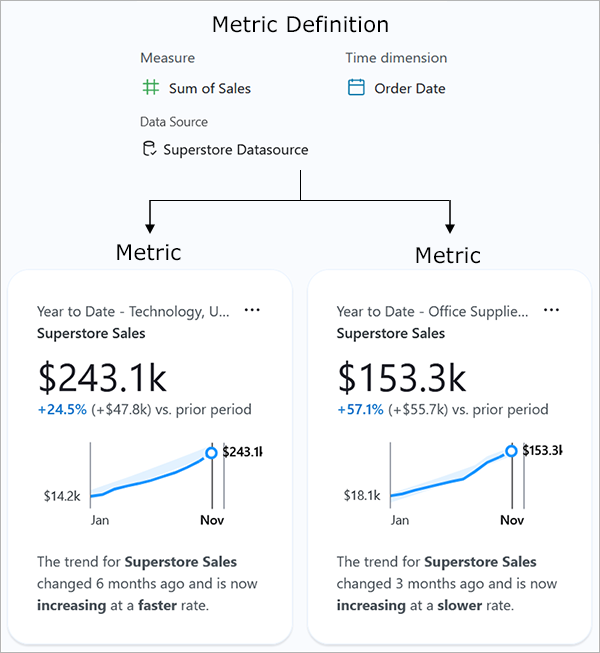
Metrics can only be created from a single published data source on Tableau Cloud. This means you need to combine, clean, and publish your data before getting started in Pulse.
How can you use Prep for Pulse?
Similar to the data that trained the original AI model, the data given to AI should be high-quality and of an appropriate variety. Additionally, metrics require these fields be present in your dataset:
- Daily or Weekly Time Dimensions
- A Measure Value
- Categorical Dimension
Below are tools and tips for each requirement. Most of the examples come from a ‘Preppin’ Data challenge about Pulse and tips from my colleagues at The Information Lab.
1) Daily or Weekly Time Dimensions
Filter Date Values
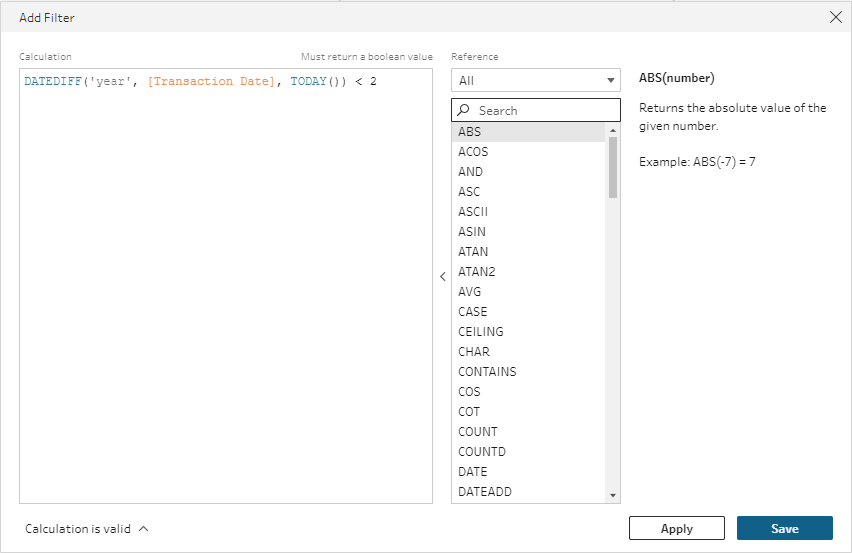
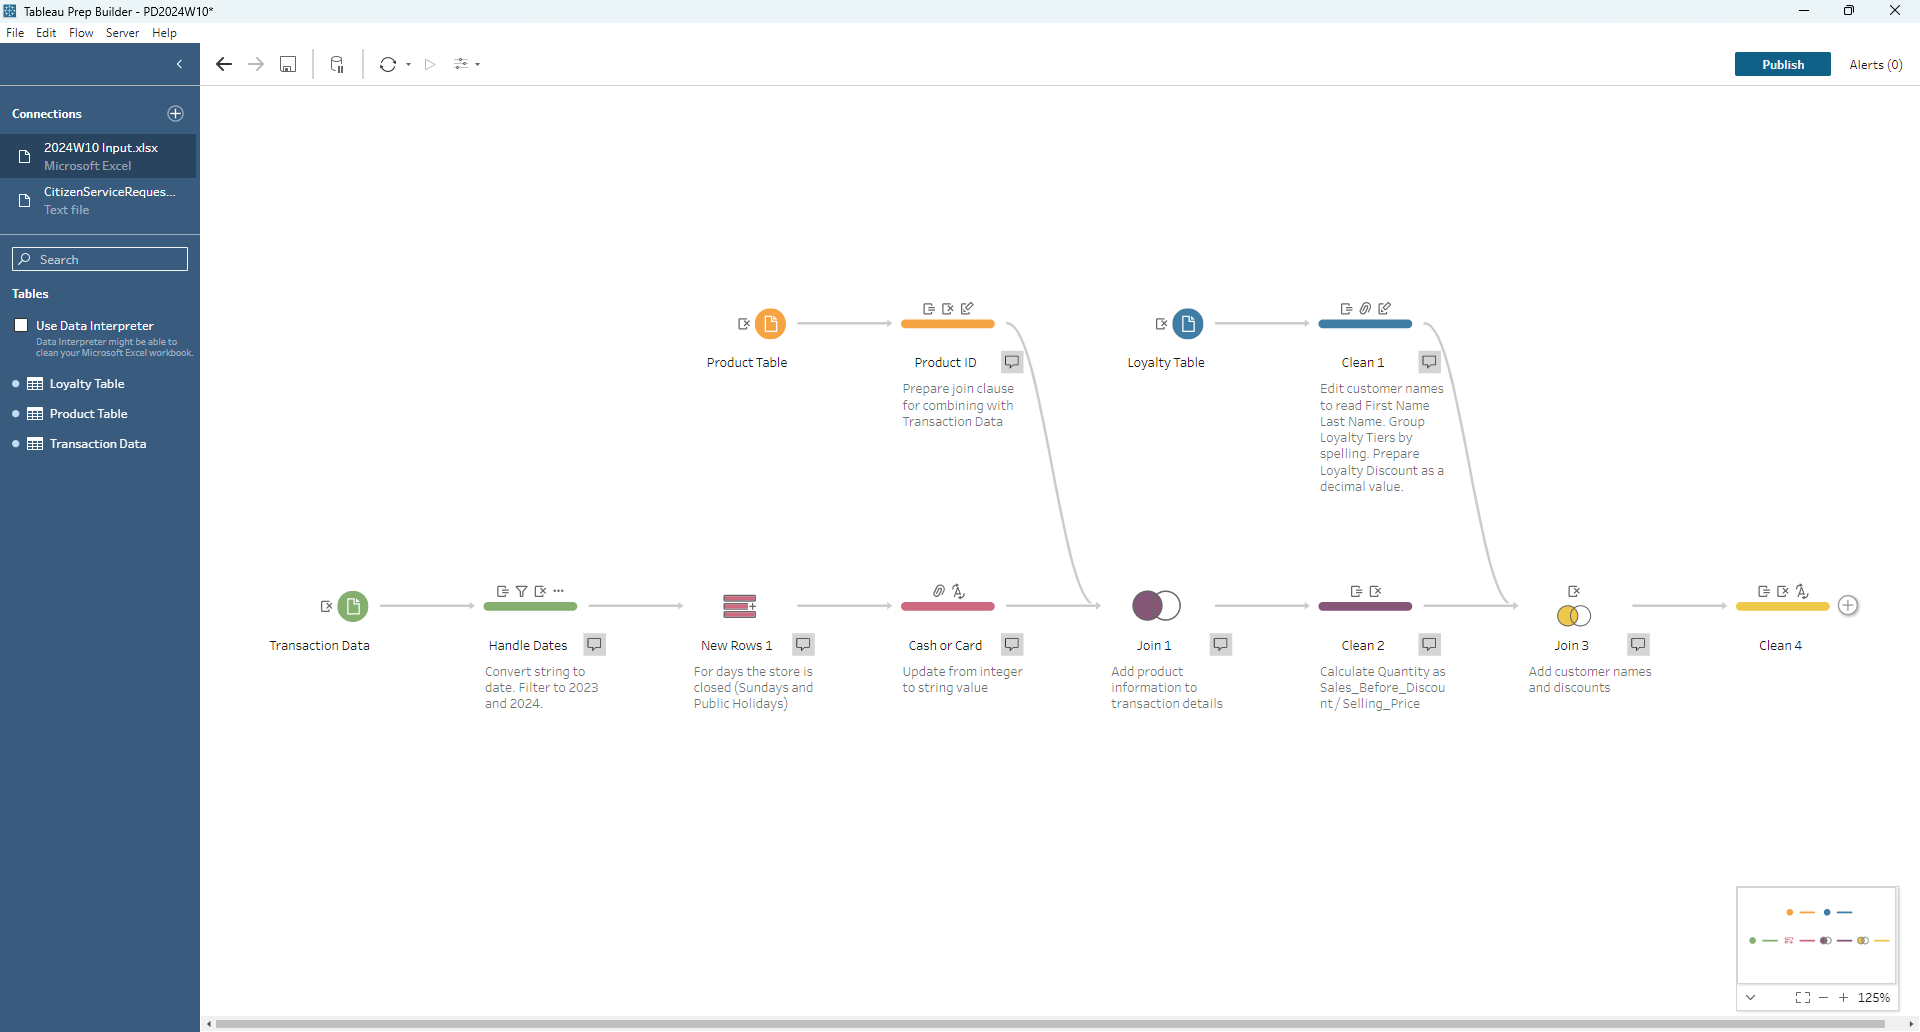
Pulse Metrics are based on relative dates, referencing Today and back to Last Year. Dates should be from the past one or two years. To future-proof this step, filter using the Filter Values option, as done for filtering the Transaction Date in the challenge:
Create Consecutive Dates
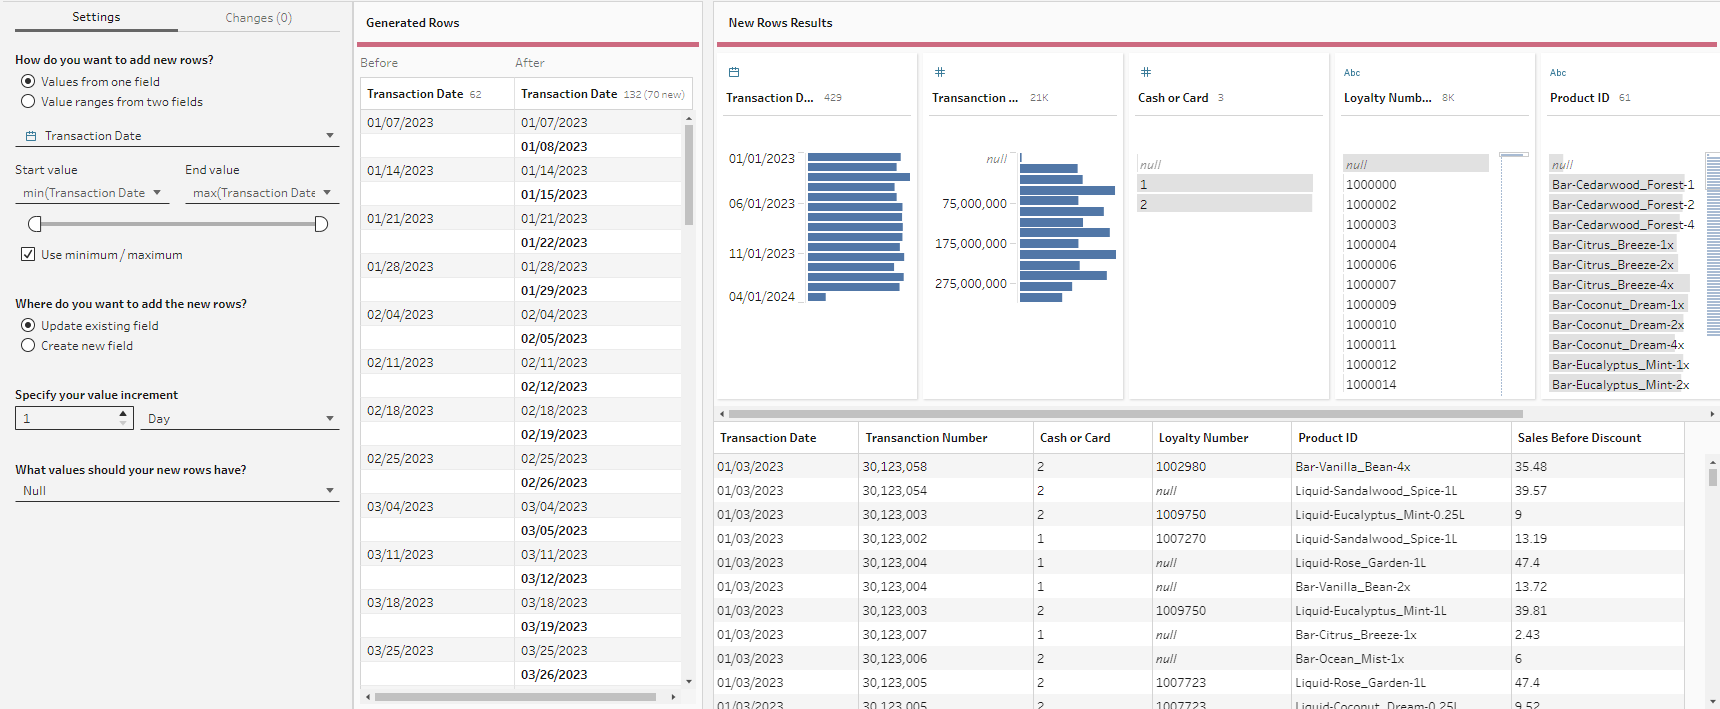
Due to holidays and closed dates, your dates may have gaps. Fill in the gaps using the New Rows step. The challenge mentions days when the company is closed for weekends and holidays, so new rows are added to fill in these days with null values.
Convert Datetime values with Date
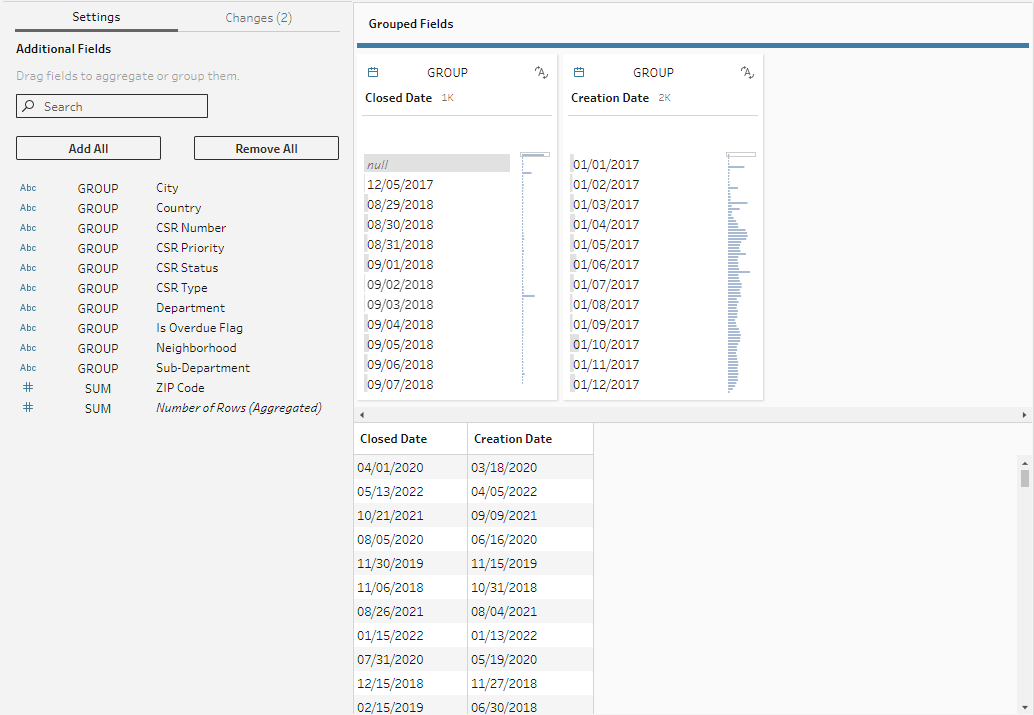
If you have timestamped data, you may need to roll up dates to a daily or weekly level using the Aggregate step. Below, a creation and close datetime field is grouped by date start to aggregate it to a daily level:
2) Measure Values
In the challenge dataset, the output metrics are related to quantity, profit, and sales. Similar to real world data, these are complex calculations based on multiple tables.
Perform Calculations
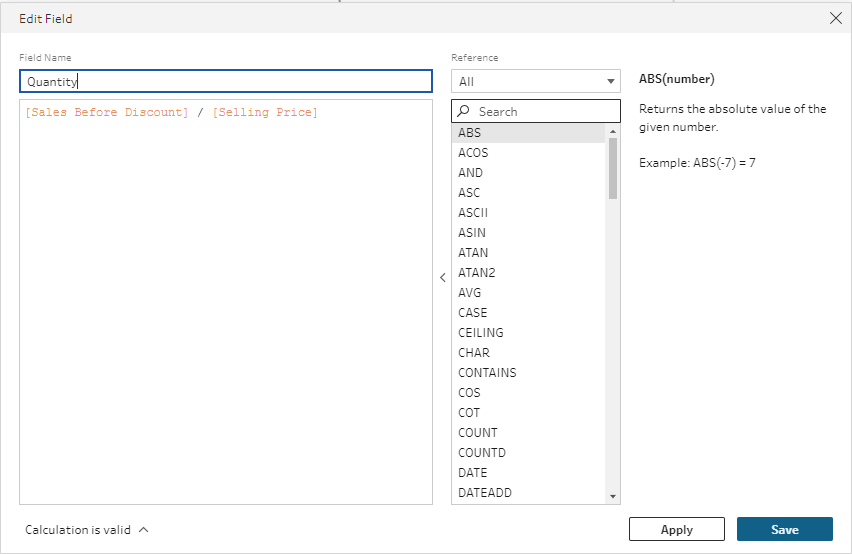
To minimize duplication errors and develop trusted data, you can perform calculations just once in a Tableau Prep flow. This is done for Quantity in the Preppin' Data Challenge.
Fill Null Measure Values
This is how Pulse renders metric timelines when there are null measure values:
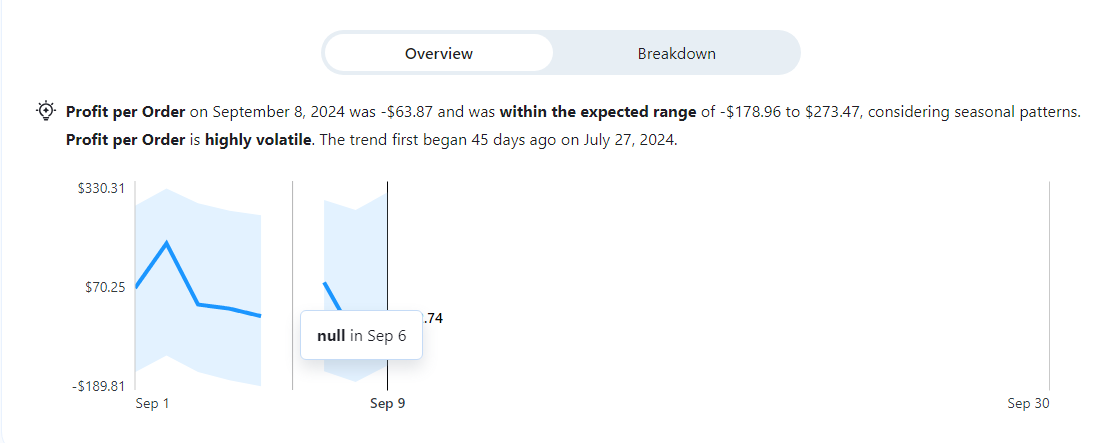
You can fill null measure values with zeros by wrapping calculations with the ZN() function. This was done for the Loyalty Discount field in the challenge where some customers did not have a loyalty membership:
ZN([Loyalty_Discount])/100Format and Convert Numerical Values
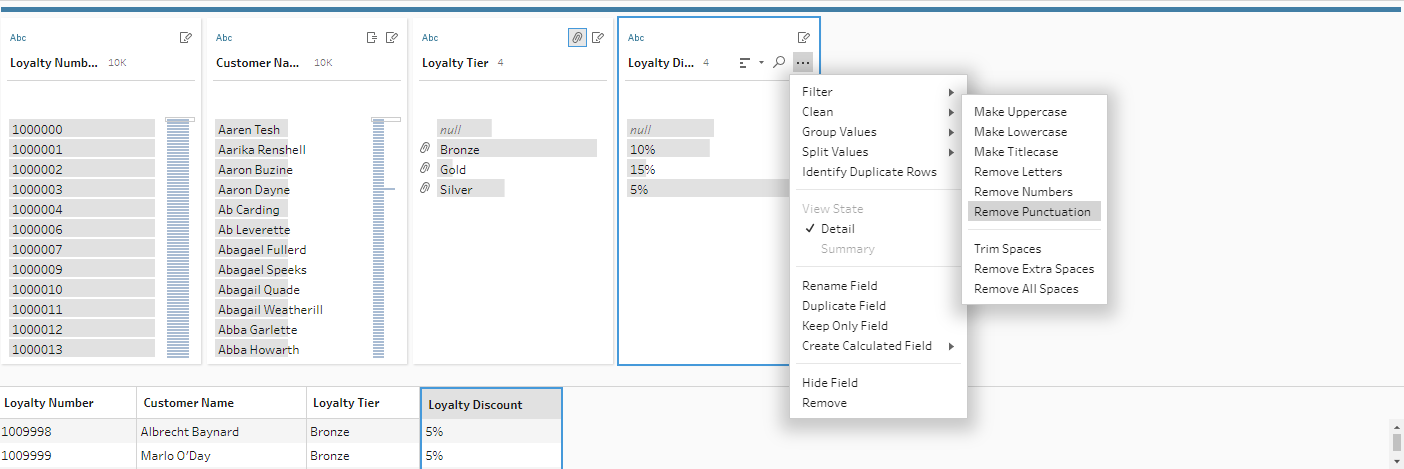
Some imported values, like percentages may be read in as strings. Quickly apply cleaning methods, like, remove punctuation, before converting these fields to numbers. For the Loyalty Discount field in the challenge, we remove the percent (%) and convert it to a number.
3) Categorical Dimensions
Get the best out of Pulse's Ask and Discovery sections by adding multiple categorial dimensions to filter and breakdown a Metric.
Replace Boolean Values, Abbreviations, and Acronyms
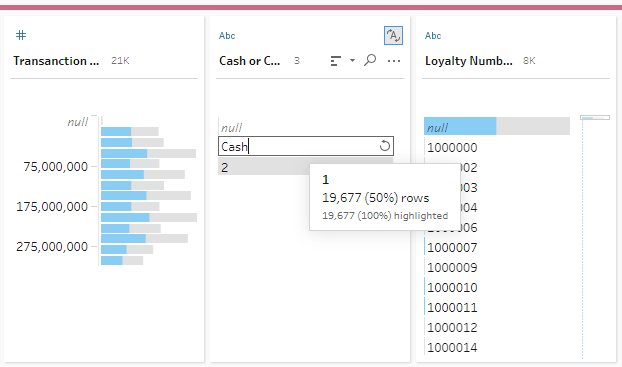
You can use natural language with Tableau AI. Ask about 'location' and it's smart enough to breakdown a metric by City or State. For encoded values and abbreviations, you should replace ambiguous language with meaningful words. In the challenge, we type directly into the encoded Cash or Credit field to replace numerical values with words:
Group Text
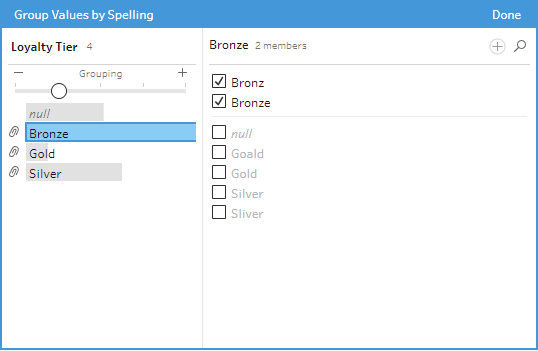
Duplicate groups may skew results. Tableau Prep has multiple Group By options that are quite intuitive with minimal manual processing. For example, the challenge requires you to Group Values by Spelling:
Format Text for Display
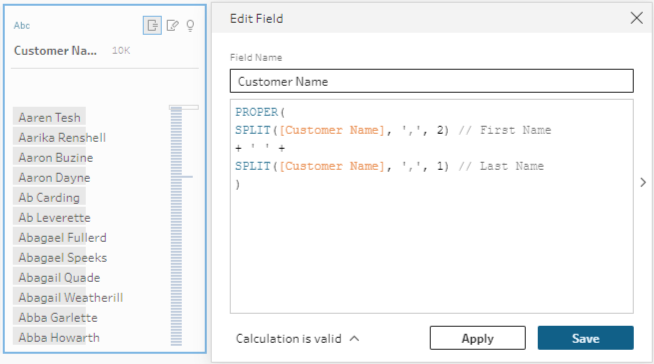
Tableau Pulse outputs the exact column names and row values it references from the data. If a column full of names is lowercase it will display as lowercase. For the human reader, it may be easier to interpret someone’s full name in proper case, as we did for customers in the challenge:
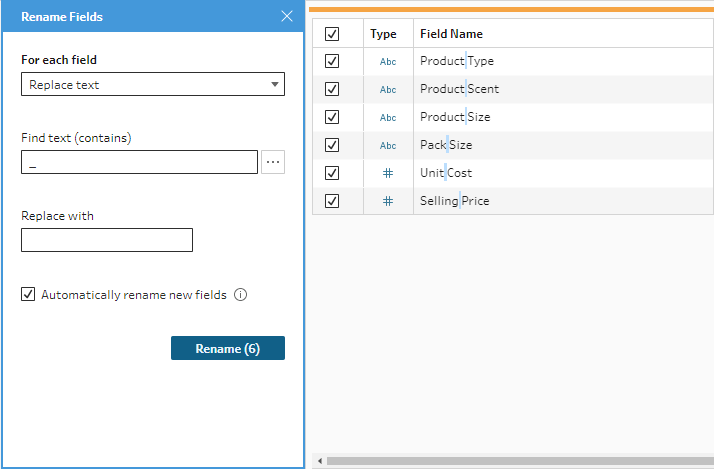
Similarly, column names with underscores will be displayed in Pulse with this punctuation. So, it is recommended that you also Rename Fields. This step was used to replace underscores with spaces for challenge fields:
Combine and Join Data
At the time of writing this, you can’t do joins and relationships within Pulse. Make sure you are combining data before publishing your data source. The Loyalty and Produce tables were joined to the Transaction table in the challenge.
How do I publish my data to Pulse?
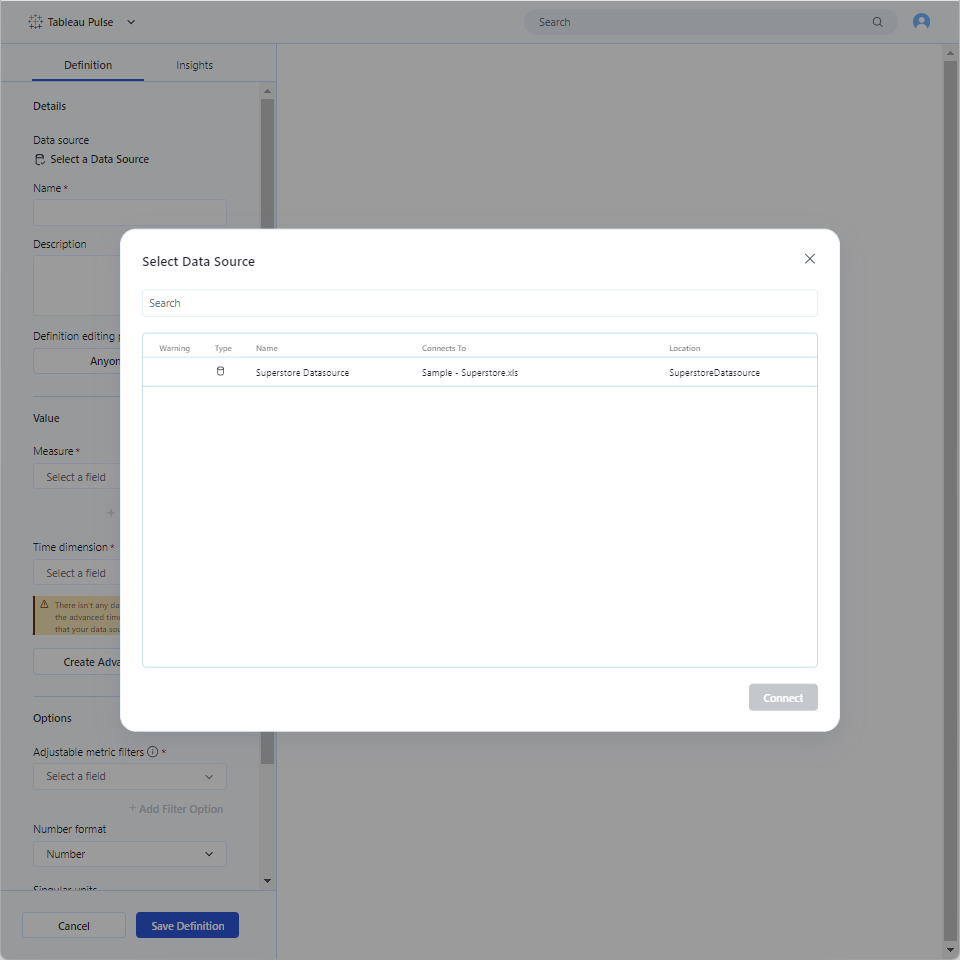
You actually don’t publish directly to Pulse. At the end of the flow, output your data directly to Tableau Cloud. Be sure to remove any unused fields to improve performance. Consider a naming convention for Pulse specific data.

All your published data sources will show as options when creating a New Metric Definition.
A Note on Security
Right now, there are limited permission settings from within Pulse for certain groups. Explorers and Creators can create New Metrics Definitions, so set data source permissions directly from your cloud site. Learn More.
Thanks for reading!
Come back to our blog as upcoming releases take us further down the Tableau Pulse Roadmap. And, see my solution to the Preppin’ for Pulse Challenge, here.
