


The third day of Dashboard week is Fromage Day! We were asked to go to cheese.com and build a search tool in Tableau. This required web scraping and a bit of creativity.
As someone who used to work in a Cheese & Wine shop, I knew I wanted a tool that would help with pairings and recipes. So, I chose to search Cheese by Texture.
View the Final Dashboard here: https://public.tableau.com/app/profile/kait.crawford/viz/SearchToolCheese_com/CheeseSearch#1
How did I do this? This blog explains the following steps in my process:
- Gathering Requirements
- Data Collection
- Data Cleaning
- Dashboard Design
- Publishing to Tableau Public
The tools I used to do this:
- Alteryx Designer for web scraping
- Tableau Desktop for data visualization
At the end of this blog, I reflect on Areas of Improvement for this project and the next.
Gathering requirements
Inspecting HTML
Similar to Day Two, I decided to explore the topic and find inspiration before diving into the data. This is essential for deciding what information to extract from the web.
As I navigated through the site, I paid attention to the URL extensions. With each click, I picked up the organization of the pages:
- Base URL: `https://www.cheese.com/
- Texture Pages:
https://www.cheese.com/by_texture/<texture>/ - Detail Pages:
https://www.cheese.com/<name-of-cheese>/
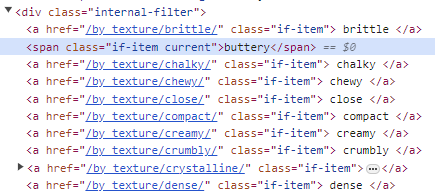
Then, I went on inspecting the HTML to see how text was organized in each tag. The textures were under the internal-filter class. The catalog internal class contained a grid of cheeses and pagination information. From this, I could make a game plan to for accessing the data.
Accessing the data
Pagination and Parsing with REGEX
I used Alteryx for Web Scraping. To start, I knew I wanted to tackle pagination. In a previous project, I created a pagination macro for APIs so I am familiar with moving from page to page. With the site for this project, the pagination information exists within the HTML. The href contains the URL extension to get to the next page. To paginate, I would have to do the following steps:
- Add this URL extension:
?per_page=100 - Retrieve all hrefs in between the
div class="pagination">tags. - Parse out page extensions.
After inspecting cheese.com further, I designed a table schema. The following shows the column name and a description of it's capture group and/or formula:
- Texture -
<a...class=if-item>()</a> - Name -
<h3><a...>()</a> - URL Extension -
BaseURL + REPLACE(LOWER(Name),'', '-') - Image -
<a href="[URL Extension]"><img src="()"> - Description -
<div class="description">...<p>()</p>
As a stretch goal, the detail pages also had summary points that would make for extra filters for my search tool.
Explore and prep the data
Clean as you call
Nearly all of the data cleaning was completed while I iteratively parsed text and made calls to the website. Once this process was complete, I did use a summary tool to see how many cheeses I was able to retrieve for each texture. This helped me decide on my final layout.
Designing the dashboard
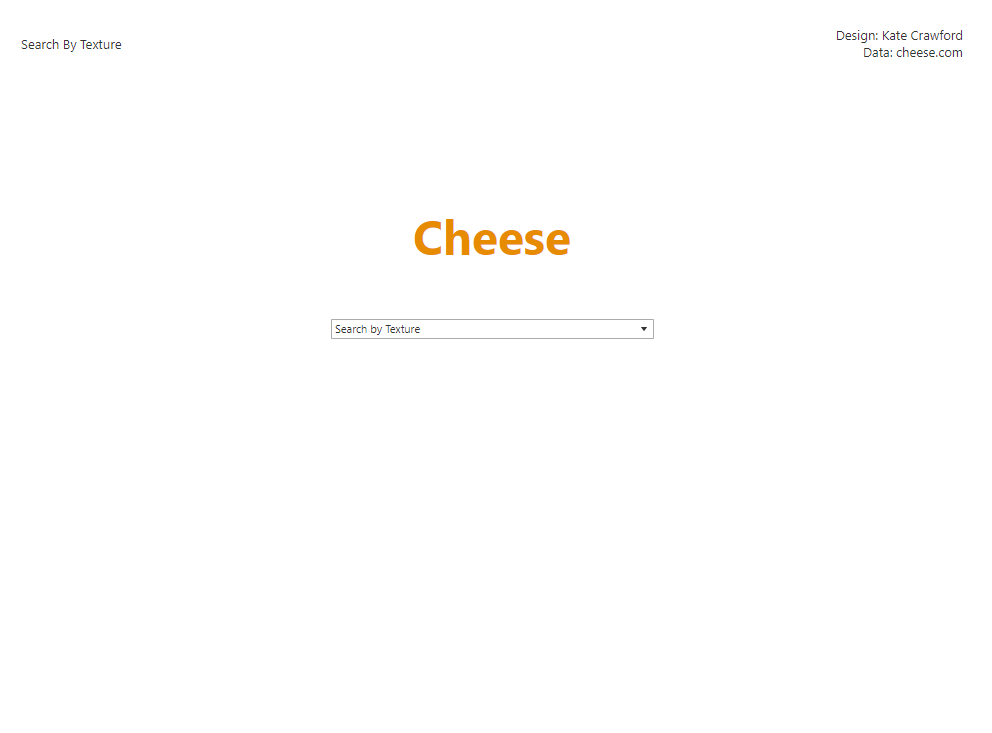
Google, but for cheese.
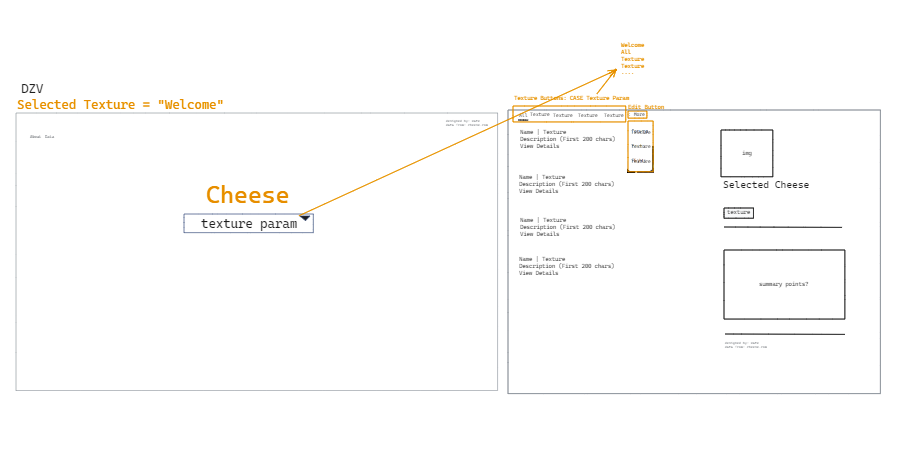
The design was inspired by the fact that cheese.com is one of those rare common word sites and this is a search tool challenge. I tried to recreate Google Search, but with cheese.
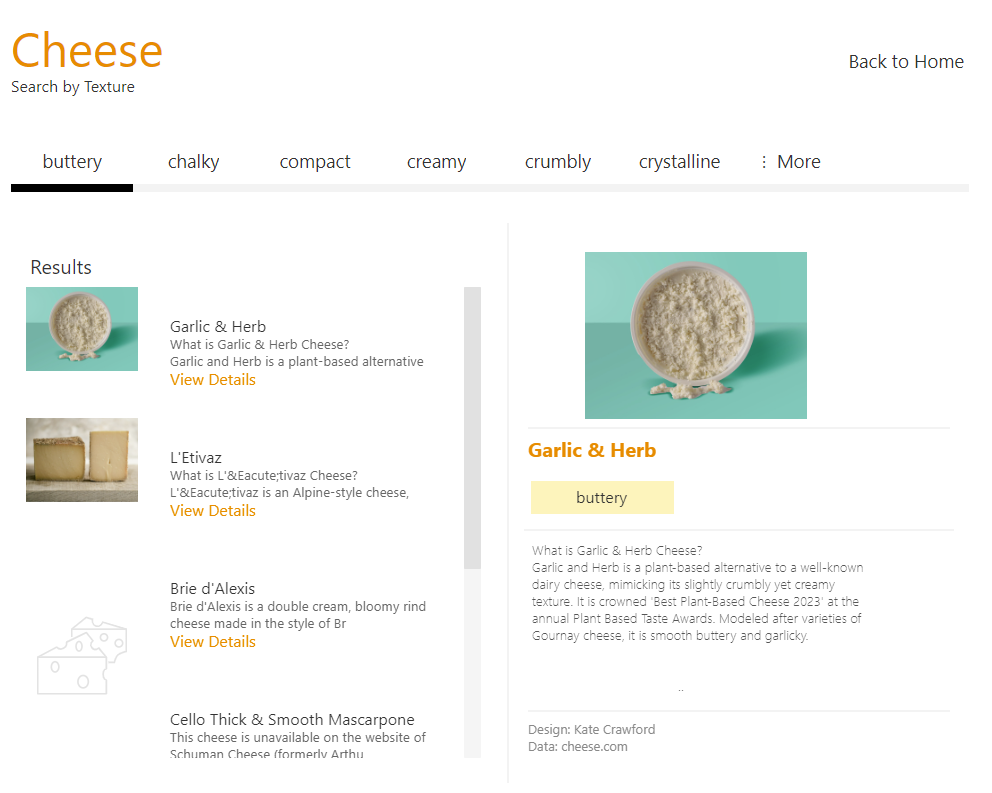
Building the dashboard
Product after the first day
Areas of Improvement
Descriptive Title in Software/Tool
- Add "All" option to selection menu
- Add summary points to dataset
- Remove irrelevant text from descriptions