


I had a go at learning context transition, and this is my understanding of the theory. I have linked all the materials I used to learn at the end of the blog.
Before diving into context transition, it is essential to first understand row context, filter context and the calculate function. Feel free to skip this section if you are familiar with these concepts.
Row context:
In Power BI, we can create a measure calculation or a column calculation, and row context refers to when a calculation knows to compute values row by row in a table. An easy way to think of it is that, in Tableau, row context is implied for all the calculations. If you put [sales]-[cost] in a calculation, Tableau would know to grab the sales and cost from the same row in the data for the computation, which is what referred as current row.
On the other hand, in Power BI, row context is only implied in column calculation but not measure, which makes sense because column calculation is attached to a table while measure is not. That is also why we need to aggregate a field when creating a measure because it doesn’t know which row you are referring to without row context.
That being said, it doesn’t mean we cannot have row context in measure. This is when we would introduce an iterator, which function is to indicate which table’s row context the calculation should be using. Take the following calculation as an example:
Measure:
Profit = SUMX(’Sales’, ‘Sales’[Sales]-‘Sales’[Cost])
In this calculation, sumx is an iterator, and it means “scan the Sales table, compute [sales]-[cost] on a row by row basis, and then give me the sum of all the differences. It would give the same output as a calculated column in the Sales table stating:
Column In 'Sales':
Profit = Sum(’Sales’[Sales]-’Sales’[Cost])
It is important to remember that row context does not filter. It merely tells the calculation to compute row by row. In terms of aggregation, sumx functions the same way as sum.
Filter context:
Filter context refers to anything that filters the number in a data model. In Tableau terms, any dimension that you drag in a sheet is a filter context. For example, if you are looking at sales by regions by years, regions and years are the filter context in this case.
Calculate function:
Calculate is the only function in DAX that allows you to alter the filter context of an expression. The syntax is as following:
CALCULATE(Expression, Filters)
E.g. CALCULATE(SUM(’Sales’[sales]),‘Sales’[years]=2024,‘Sales’[region]=”South”)
Explanation: Give me the sum of Sales for when Years = 2024 and Region = South
Context transition:
Context transition is one of the operations that Calculate performs. It happens when Calculate is executed inside of a row context. It will transform the row context into an equivalent filter context and apply the filter context to the data model before computing the expression. Take the following calculation as an example:
Measure:
Sum of Avg Sales = SUMX(VALUES('Orders'[Customer ID]) → Row Context
,CALCULATE(SUM('Orders'[Sales])/COUNT('Orders'[Order ID]))) → Calculate( )
Explanation:
VALUES('Orders'[Customer ID] = create a table with one column that contains a unique list of Customer ID
In this calculation, since there is a Calculate function happening inside of a row context, context transition is happening. The row context of Customer ID has turned into a filter context. With the filter context, this calculation is saying "give me the average sales per customer, and then give me the sum of all the average sales". To put it in simple terms, context transition affects the order of which a calculation is computed.
The concept of context transition is simple, converting row context into filter context. The difficult part is to spot when it is happening. As mentioned before, row context is implied when creating calculated columns. Another hidden rule is that the Calculate function is implied when referencing a measure in a calculation, which means context transition is also happening in the following calculation.
Column In 'Sales':
Price Sold = [Actual Revenue]
Context:
Measure:
Actual Revenue = SUM('Sales'[Sales])*SUM('Sales'[Discount])
Since the Calculate function is implied when referencing a measure, the above calculation is actually doing:
Column In 'Sales': → Row Context
Price Sold = Calculate([Actual Revenue]) → Calculate( )
As you can see now, row context and the Calculate function are both present in this calculation. And because of that, context transition is happening here.
I would like to end the blog with a use case of context transition. Below is a measure that returns a three months rolling average on sales.
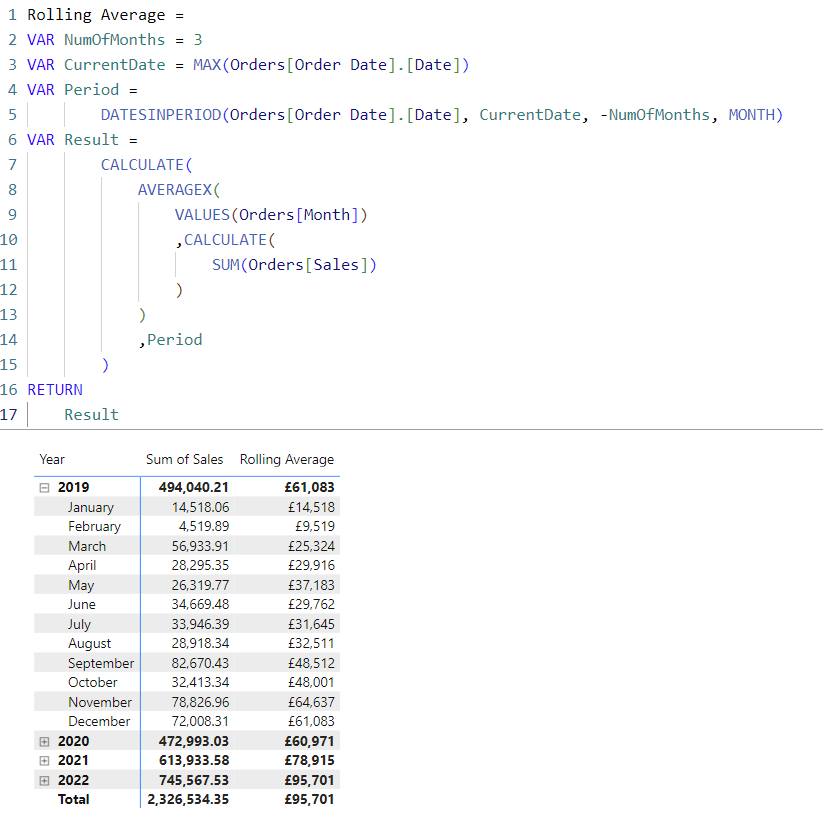
With the recent introduction of Visual Calculation, you can now calculate moving average with a much simpler calculation. But this is how you would do it with DAX, and I think this is a good example to show when context transition is needed.
In the above calculation, context transition happened in this part:
Result = CALCULATE(
AVERAGEX(VALUES(Orders[Month]) → Row Context
,CALCULATE(SUM(Orders[Sales]))) → Calculate( )
,Period)
With the 'Orders'[Month] being converted into a filter context, I am asking the calculation to return the sum of sales per month, and then average the sum with the period I specified.
Let's have a look and see what the calculation would return without context transition.
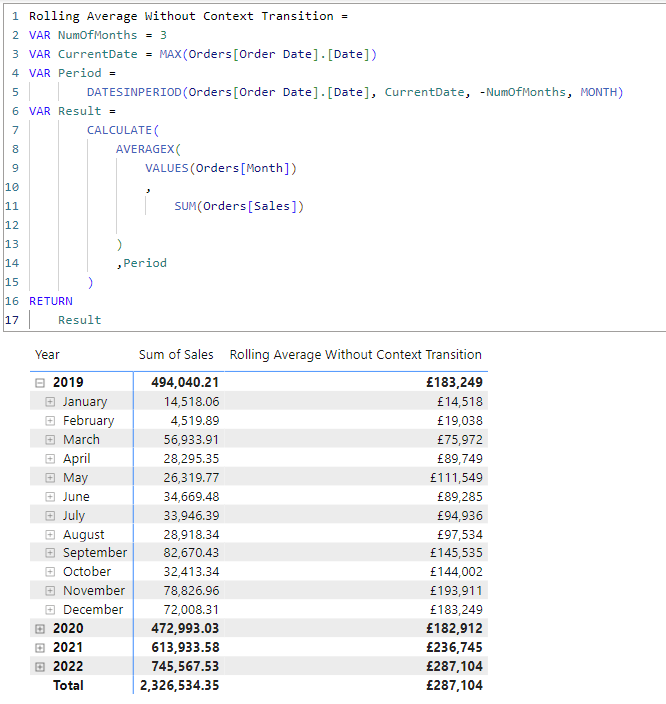
In the above calculation, since the measure did not change the filter context of Values(Orders[Month]), the calculation is picking up the filter context from the matrix, which is the Order Date, because as mentioned before, every dimension that you put in a chart is a filter context. Now the calculation is first doing an average of sales per month. In the case of January, it is £14,518/1(month). So the average of month is really the same amount as the sum of sales. Then the calculation sums all the averages within the period specified. And that is why it is now returning the running sum of sales of every three months.
Materials I used:
https://www.sqlbi.com/articles/row-context-in-dax/
https://www.sqlbi.com/articles/filter-context-in-dax/
https://www.sqlbi.com/articles/understanding-context-transition-in-dax/