


Today task is to use the internet boyband data base to build a dashboard. The complete instruction can be found here: https://www.thedataschool.co.uk/robbin-vernooij/ds38-dashboard-week-day-4-boy-bands/.
Since today is the last day of my dashboard week, I wanted to make something fun. As soon as I saw that the database has the appearance description of the boyband members, I decided to make a dashboard where people can choose different appearance features and see the matches of boyband members. To make it more fun, I want an icon of the chosen combination to show up as well.
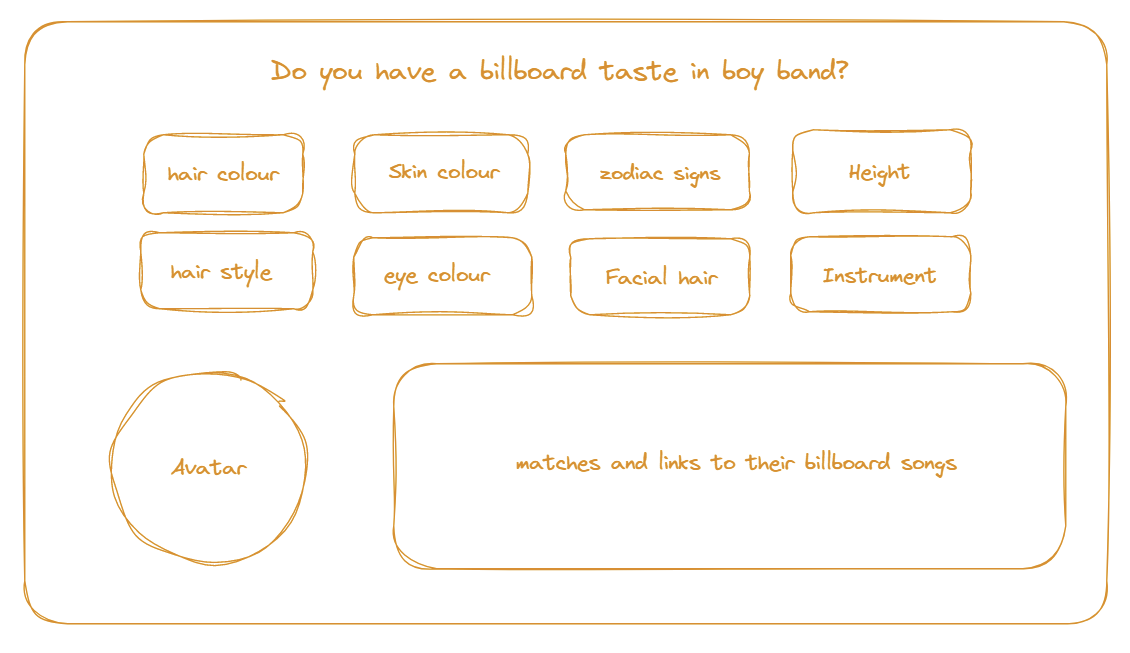
The chart and the filters are fairly easy to make. The difficult part is to have all the different combinations of icons and to have them matching up with the descriptions.
I spent some time searching online for a icon generator and I decided to use Avataaars Generator as it has a simple interface. Since I have to make a total of 68 icons, a simpler interface would make things easier for me.
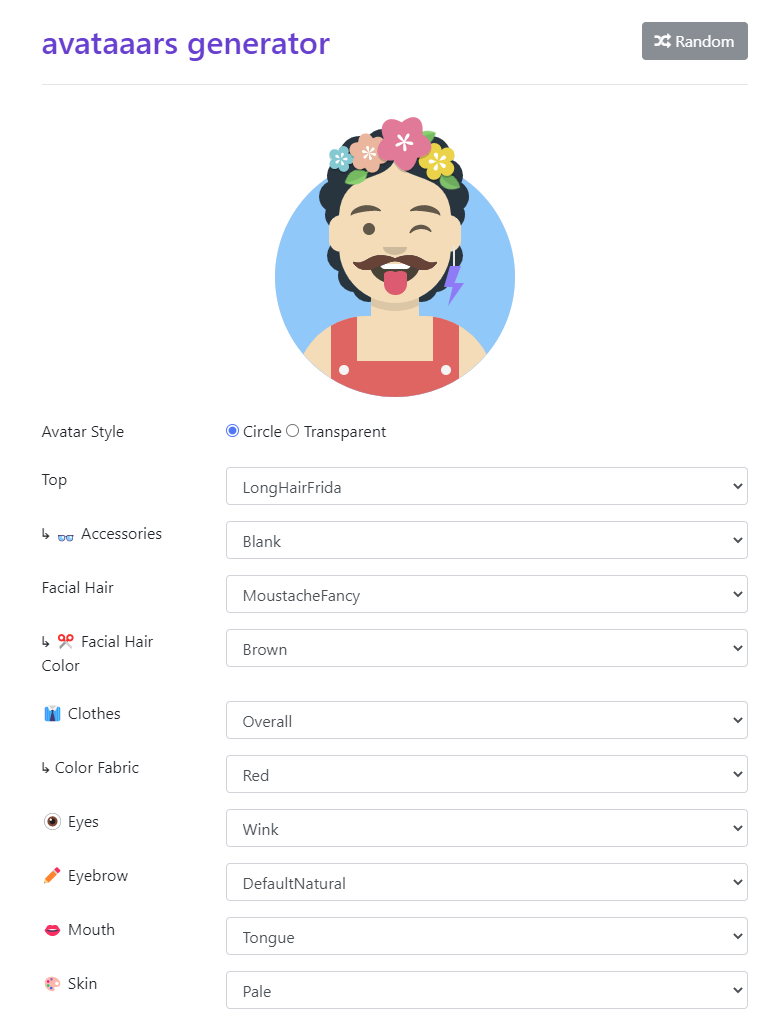
Here is the link to the website if you're interested in making some icons for yourself: https://getavataaars.com/
Most of my time was spent generating icons and matching the icon with the descriptions on tableau. If you are interested in how I did it, I wrote another blog to explain the process.
Link to that blog post: https://www.thedataschool.co.uk/karina-chan/how-to-match-icons-with-a-combination-of-dimensions-in-tableau/
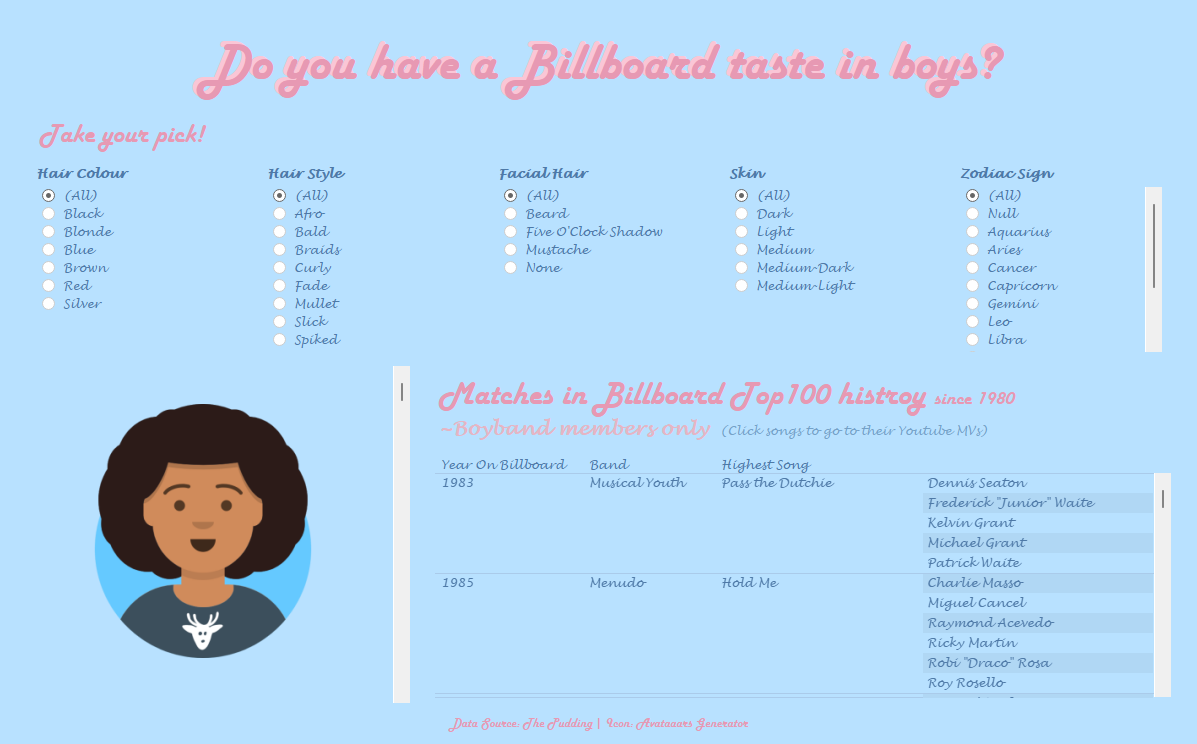
This is my final dashboard. I am happy with the result as it does exactly what I pictured it to be. Also, it is a fun one to explore for the audiences.
Link to the dashboard: https://public.tableau.com/app/profile/karina.chan/viz/Doyouhaveabillboardtasteinboys/Billboard#1