Today's task is to use any NASA API to pull in data, and then make a dashboard out of it. The full instruction can be found here: https://www.thedataschool.co.uk/robbin-vernooij/ds38-dashboard-week-day-3-nasa/.
After having a look at NASA API list, I decided to use the solar flare API because I found the topic interesting. I processed the API in Alteryx and it was a fairly straight forward process. However, I changed my scope after I cleaned the data as I realised the data size is rather small. So I proceeded to pull in more data on space weather, including geomagnetic storm, high speed stream etc. I then had a plan of making a dashboard about geomagnetic storm and using the other data to explain the cause of geomagnetic storm as they are all associated.

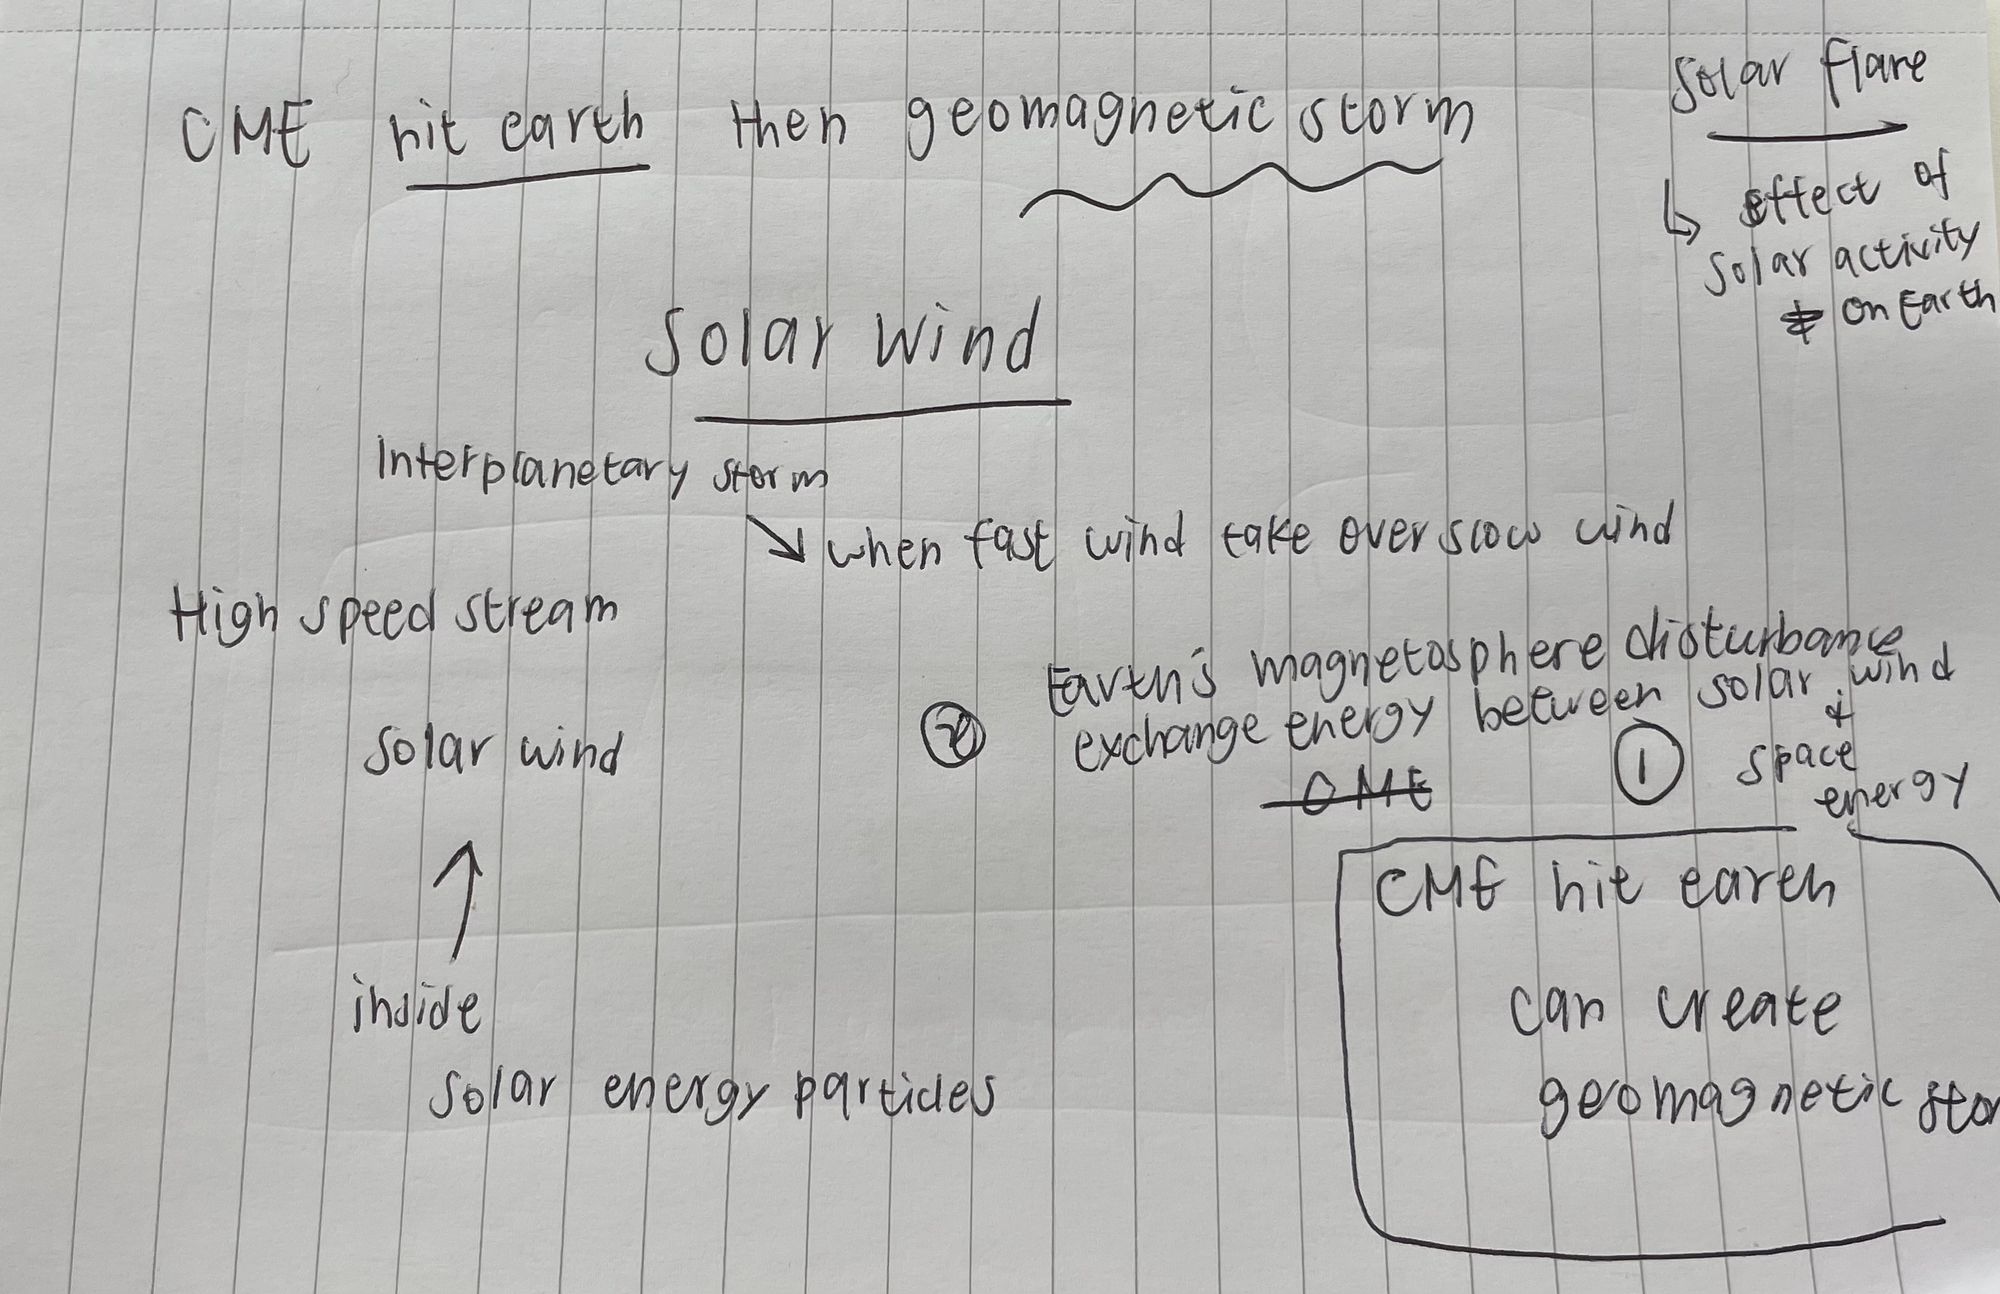
I also started to do research on the topic and wrote down the relationship between weather factors.

But then I soon realised I did not know this topic enough to be able to make a such complicated dashboard in a short period of time. So I went back to my original idea of making a dashboard on solar flares.
There was not a lot to explore with the solar flare data as its size was rather small. Therefore, I decided to make an exploratory dashboard with a photo of solar flare (because it is really pretty!!). This is the sketch I gave up with, and below that is the final dashboard I made.


I am not very satisfied with my final dashboard. I believe if I did not spend the whole morning researching on multiple space weather topics, I would be able to come up with a better design and analysis angle for the dashboard. However, I am still glad that I noticed I was over-scoped midway and managed to finish a dashboard in time.
Link to my dashboard: https://public.tableau.com/app/profile/karina.chan/viz/SolarFlaresInMay2023/SolarFlare?publish=yes
