Adding the ability to add and remove labels in Tableau can greatly enhance the functionality and flexibility of your data visualizations. One way to accomplish this is by using a parameter to control the visibility of labels. In this blog post, I will walk through the steps of creating a parameter, linking it to a calculated field, and using it to control the visibility of labels in a Tableau visualization. I’m using the superstore dataset to demonstrate my steps.
Step 1: Create a Parameter
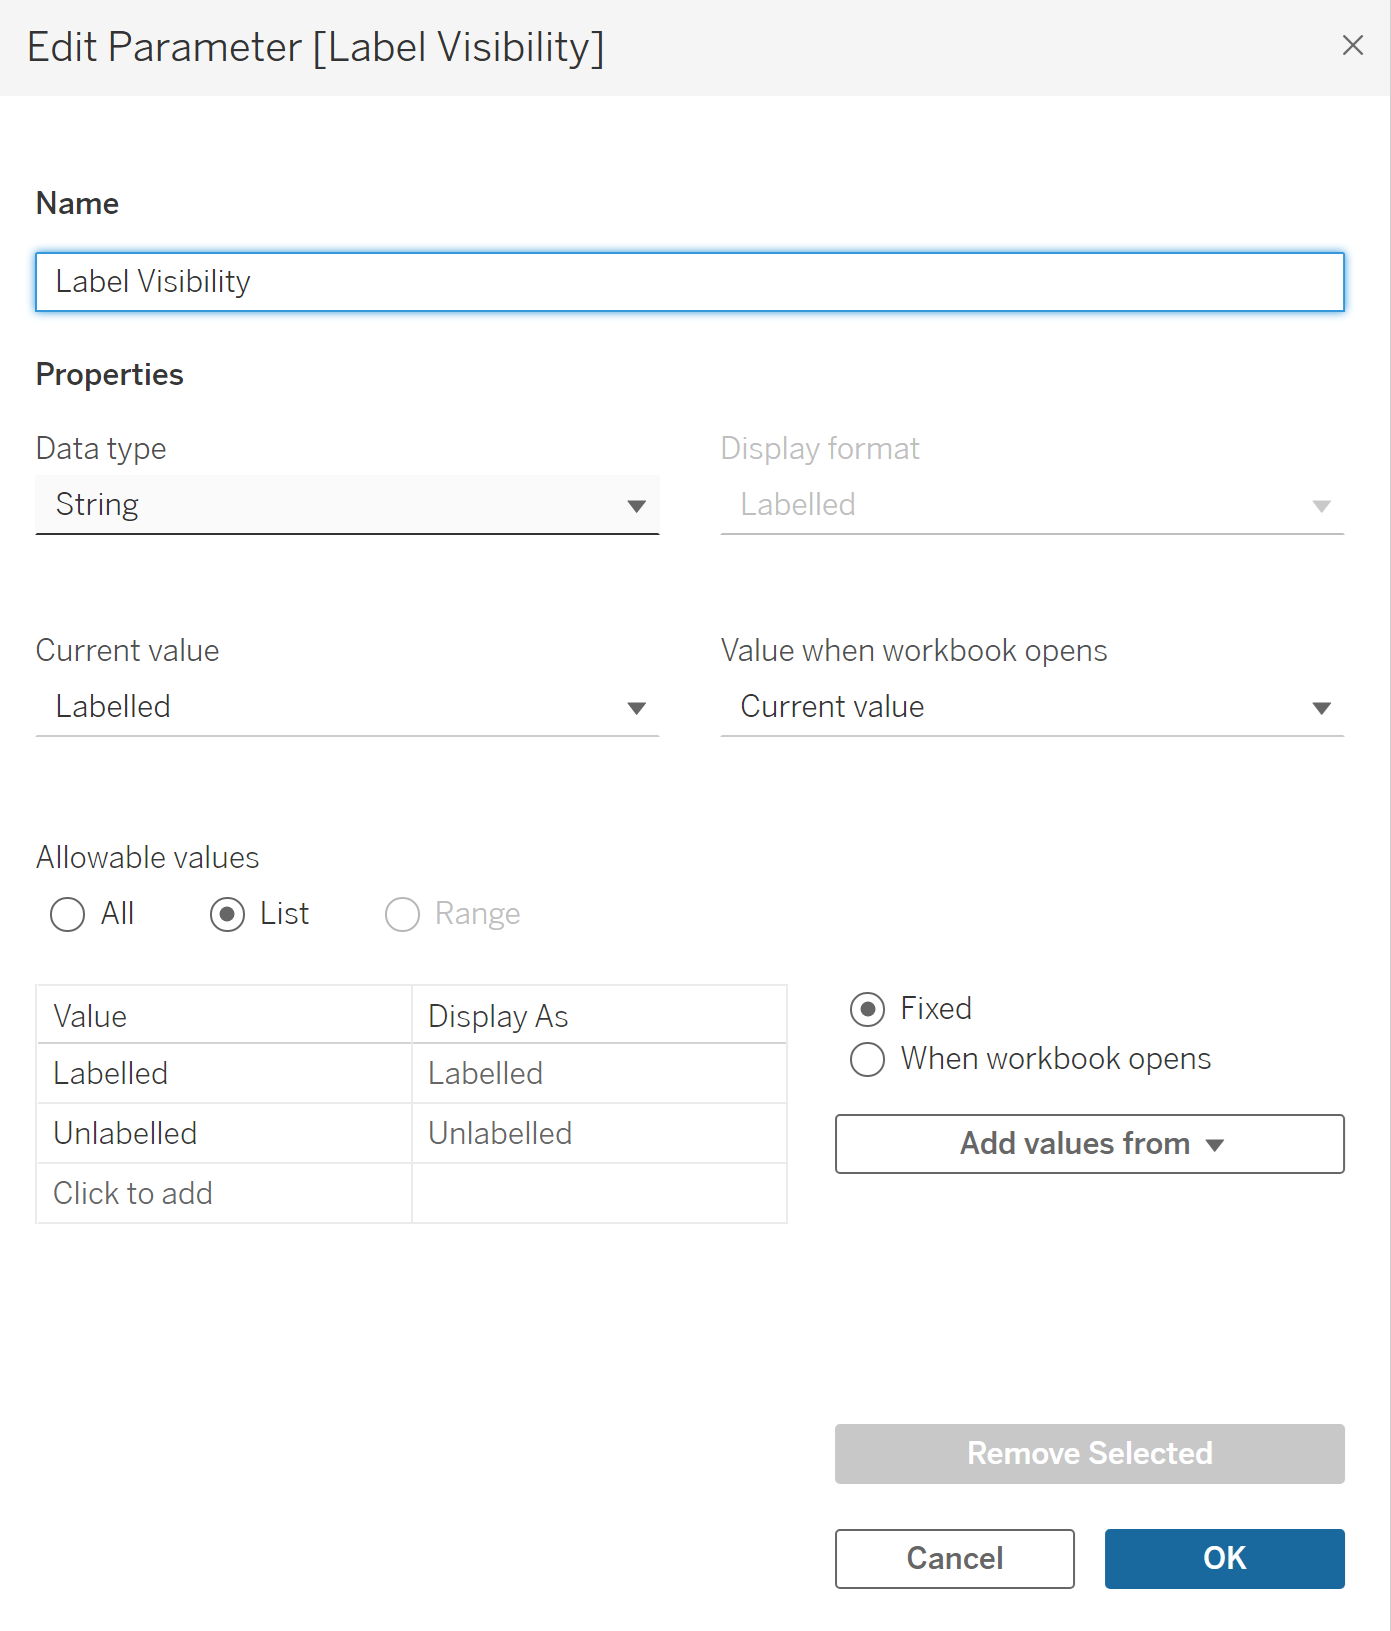
In Tableau, go to the "Data" pane and click on the "New Parameter" button. In the "Create Parameter" dialog box, give the parameter a name (e.g. "Label Visibility"), set the data type to "String", and set the allowable values to "Labelled" and "Unlabelled".

Step 2: Create a Calculated Field
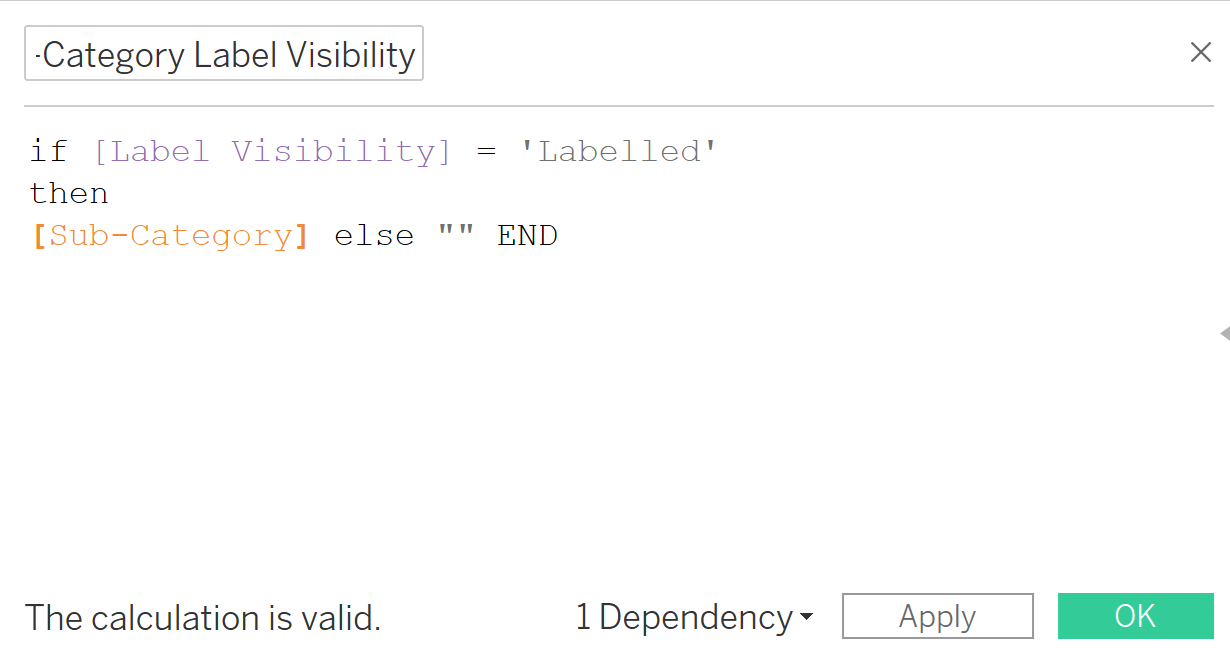
Next, create a calculated field that will be used to control the visibility of the labels. In the "Calculations" pane, click on the "New Calculated Field" button. In the formula box, enter the following formula:
IF [Label Visibility] = ‘Labelled’ THEN [Sub-Category] ELSE “” END
This calculated field will return the label names of the Sub-Categories when the parameter is set to "Labelled" and will have no labels when it is set to "Unlabelled".

Step 3: Control Label Visibility
Now that the parameter and calculated field have been created, we can use them to control the visibility of the labels in the visualization. Drag and drop the new calculated field to the “Label” card on the Marks card.
Step 4: Add a Checkbox
To make it user-friendly, you can add a checkbox that is bound to the parameter created in step 1. This allows the user to easily toggle the labels on and off. To do this, right click on the parameter in the data pane and select ‘Show Parameter’. This should allow you to select Labelled or Unlabelled.
Finally, you may want to tick in the Label Marks card ‘Allow labels to overlap other marks’ to be able to see all the labels.
Step 5: Publish and Share
Finally, publish your workbook to Tableau Server or Tableau Public and share the link with others. With the added parameter and checkbox, your users will now be able to easily add or remove labels from the visualization as needed.
This is what your final product should look like:

By following these steps, you can add a level of interactivity and flexibility to your Tableau visualizations, giving your users the ability to add or remove labels as needed. As always, be sure to test your workbook thoroughly before publishing it.
