


In Power BI, efficient data modeling is crucial to creating effective reports and dashboards. A core component of this process involves leveraging calculated tables. Unlike tables imported from data sources, calculated tables are defined by DAX expressions, providing dynamic and customizable solutions for complex data modeling challenges.
One of the most common use cases for calculated tables is creating a Date Table. A date table is a table that contains a comprehensive list of dates and related attributes such as year, quarter, month, day, and potentially fiscal periods or holidays. It is crucial for time-based analysis, as it allows you to perform calculations like year-over-year growth, and moving averages, and use DAX time intelligence functions seamlessly.
Note: You can use time intelligence functions in Power BI only if there is a properly configured Date Table in your data model.
For a table to qualify as a Date Table, the following requirements need to be met:
1. It must contain a column with data type - Date/time.
2. This column must cover a continuous range of dates, including all the periods required for the analysis.
3. The values in this column must be unique and should not have any nulls or blank values.
4. The table must be marked as a date table.
Creating a Date Table
There are several ways to generate a date table in Power BI, each with its own advantages depending on your specific needs and data model.
A. External Source: If you have a predefined date table in an external source, such as an Excel file, SQL database, or CSV, you can simply import it into Power BI like any other table.
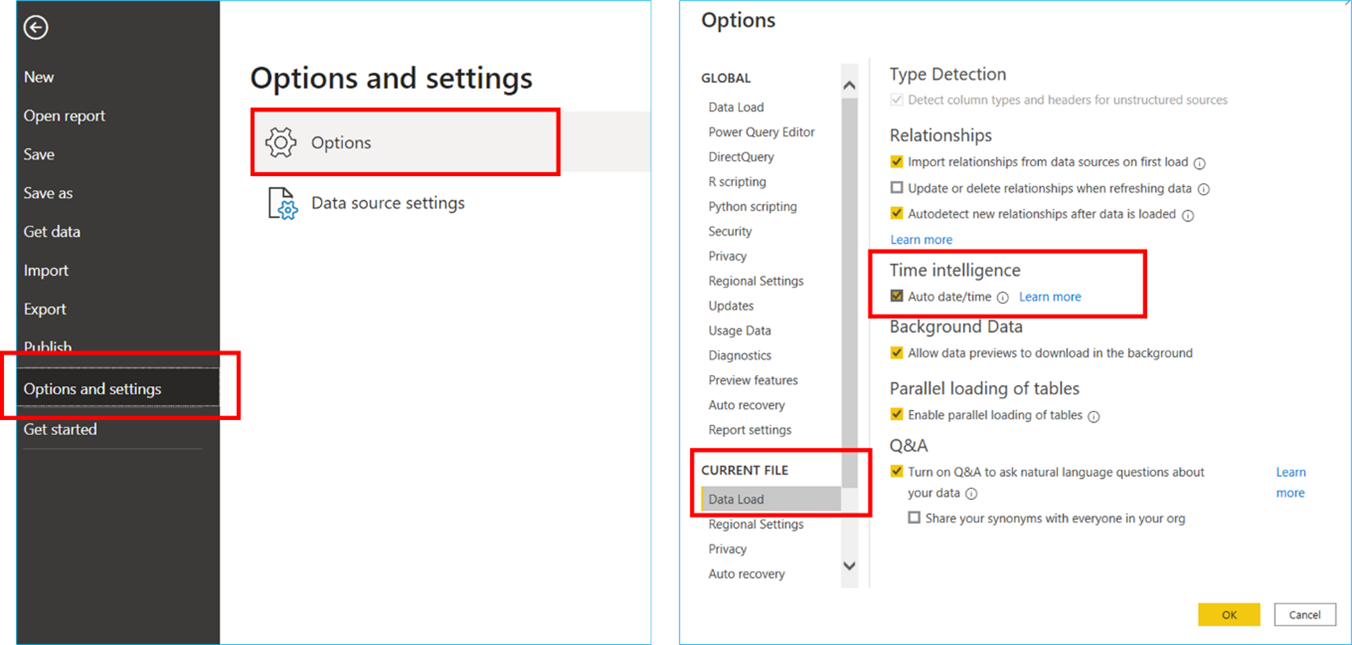
B. Auto Date/Time Feature: Power BI has an auto date/time feature that automatically generates a hidden date table for each date column in your model. It is a convenient and fast method but requires the Auto date/time option to be enabled. It can be enabled by navigating to the:
File > Options and Settings > Options > Current File > Data Load > Time Intelligence > Enable Auto date/time
Once this feature is enabled, when you will load data into Power BI, it will check for any columns with a date or datetime data type and will automatically generate a hidden date table that spans from the earliest to the latest date present in the data.
One of the many limitations of this feature is that it doesn’t support “Single Date Table Model” (i.e. A single date table serves as the central point for all date-related analysis). So when dealing with large datasets, creating a custom date table is recommended.
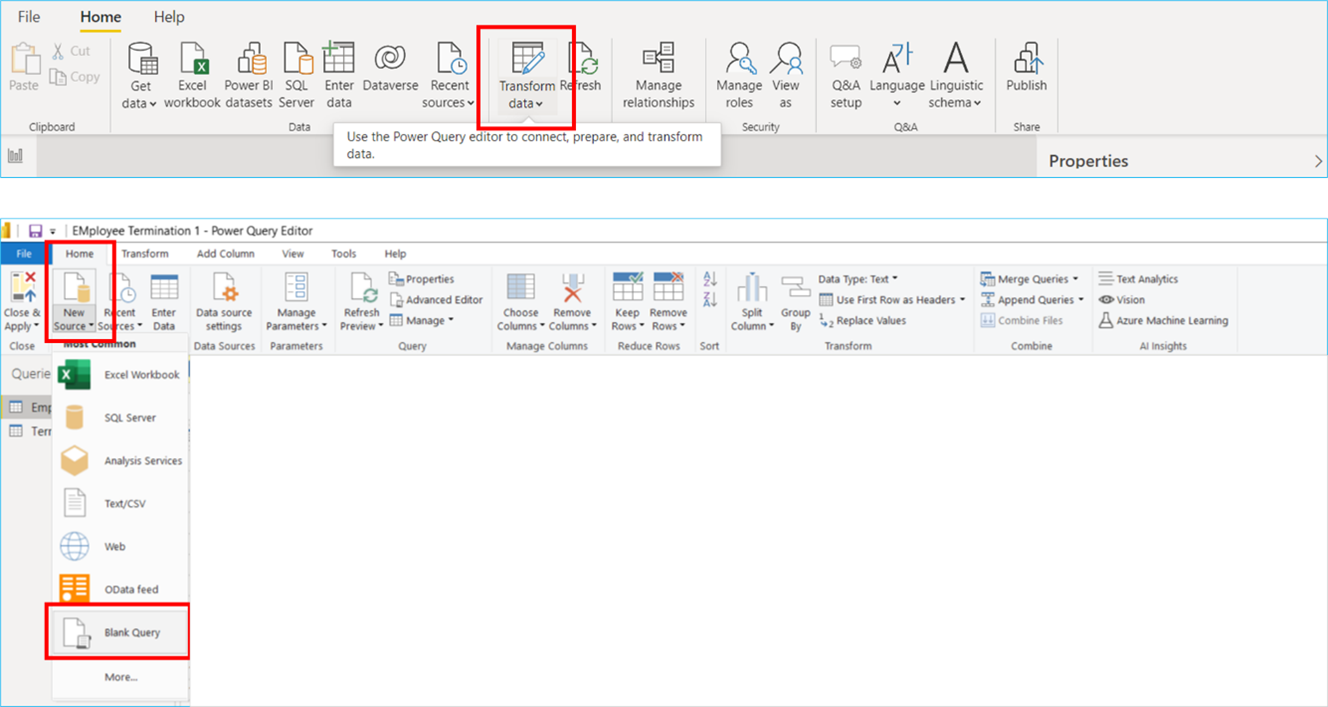
C. Power Query: Power Query provides a flexible and efficient way to generate a date table by using the M language to define your date range and additional columns. To do so, In Power BI Desktop, click on "Transform data" to open Power Query Editor. In the Home tab, select New Source > Blank Query.
Then enter the required M-query.
Syntax: = List.Dates(start as date, count as number, step as duration).
Example: = List.Dates(#date(2022,01,01), 365, #duration(1,0,0,0))
It will give a list of all dates starting from 01st January 2022 to 31st December 2022.
D. DAX: Power BI allows you to create calculated tables using DAX (Data Analysis Expressions). This method is useful when you need to create a date table directly within your data model.
To create a date table in your model, use either the CALENDAR or CALENDARAUTO DAX functions. Essentially, both functions are the same, with the only difference being how the start date and end date are defined.
CALENDARAUTO – The range of the dates is calculated automatically based on the data in the model.
CALENDAR – The range of the dates is calculated based on the start and end date (both inclusive) specified in the formula.
Syntax: CALENDAR(<start_date>, <end_date>)
Your start date should be smaller than the end date for the DAX function to work
Both of the above DAX functions will generate a single column named “Date” with a continuous set of dates. Using DAX functions, other columns such as Year, Quarter, and Month can be created to support the filtering and grouping requirements.
Marking a Date Table
Once you have created the date table using one of the methods mentioned earlier (except Auto Date/Time), the next step is to designate it as a Date Table. You can do this in the Data view by either
a. Right-clicking the table's name in the Fields pane and choosing the "Mark as Date Table" option or
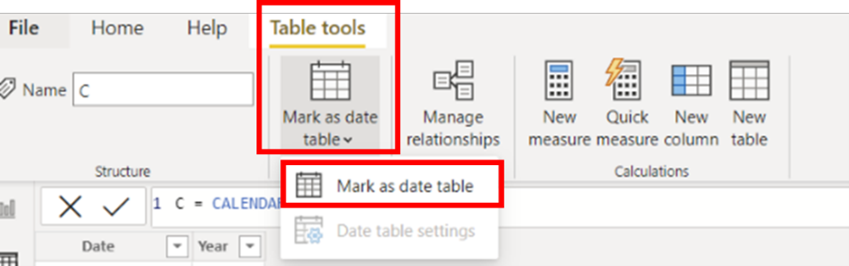
b. From the Table Tools tab, select “Mark as Date Table”
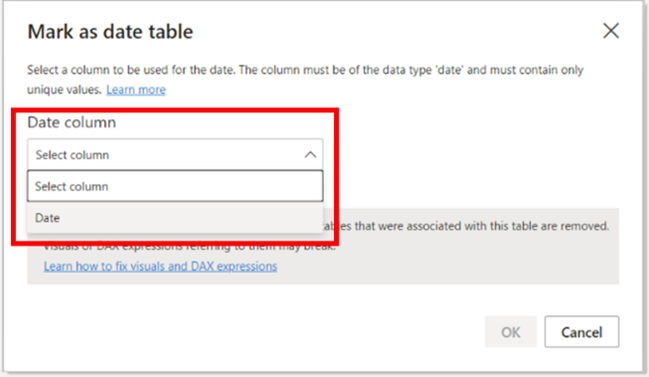
In both cases, a dialog box will appear asking you to specify the column that contains your date values. Select the appropriate column from the dropdown list that contains the unique, contiguous dates. And Click Ok to confirm the selection.
Now that you have a Date Table, you can bring this table in your Data model and build relationships with other tables.
Conclusion
Each method of creating a date table in Power BI has its own benefits and trade-offs. Choosing the right approach depends on your specific needs, such as performance requirements, the complexity of the date logic, and your familiarity with DAX or Power Query. For most scenarios, using DAX or Power Query offers the best balance of flexibility and performance, while importing an existing table ensures consistency across multiple reports. The auto date/time feature provides simplicity and ease of use but is less suitable for complex or large-scale models.