This guide will help you improve your data cleaning with PowerQuery significantly. These settings are a must when working with large data sets.
Sample of the data show bellow is to large to scroll down and check each row one by one.
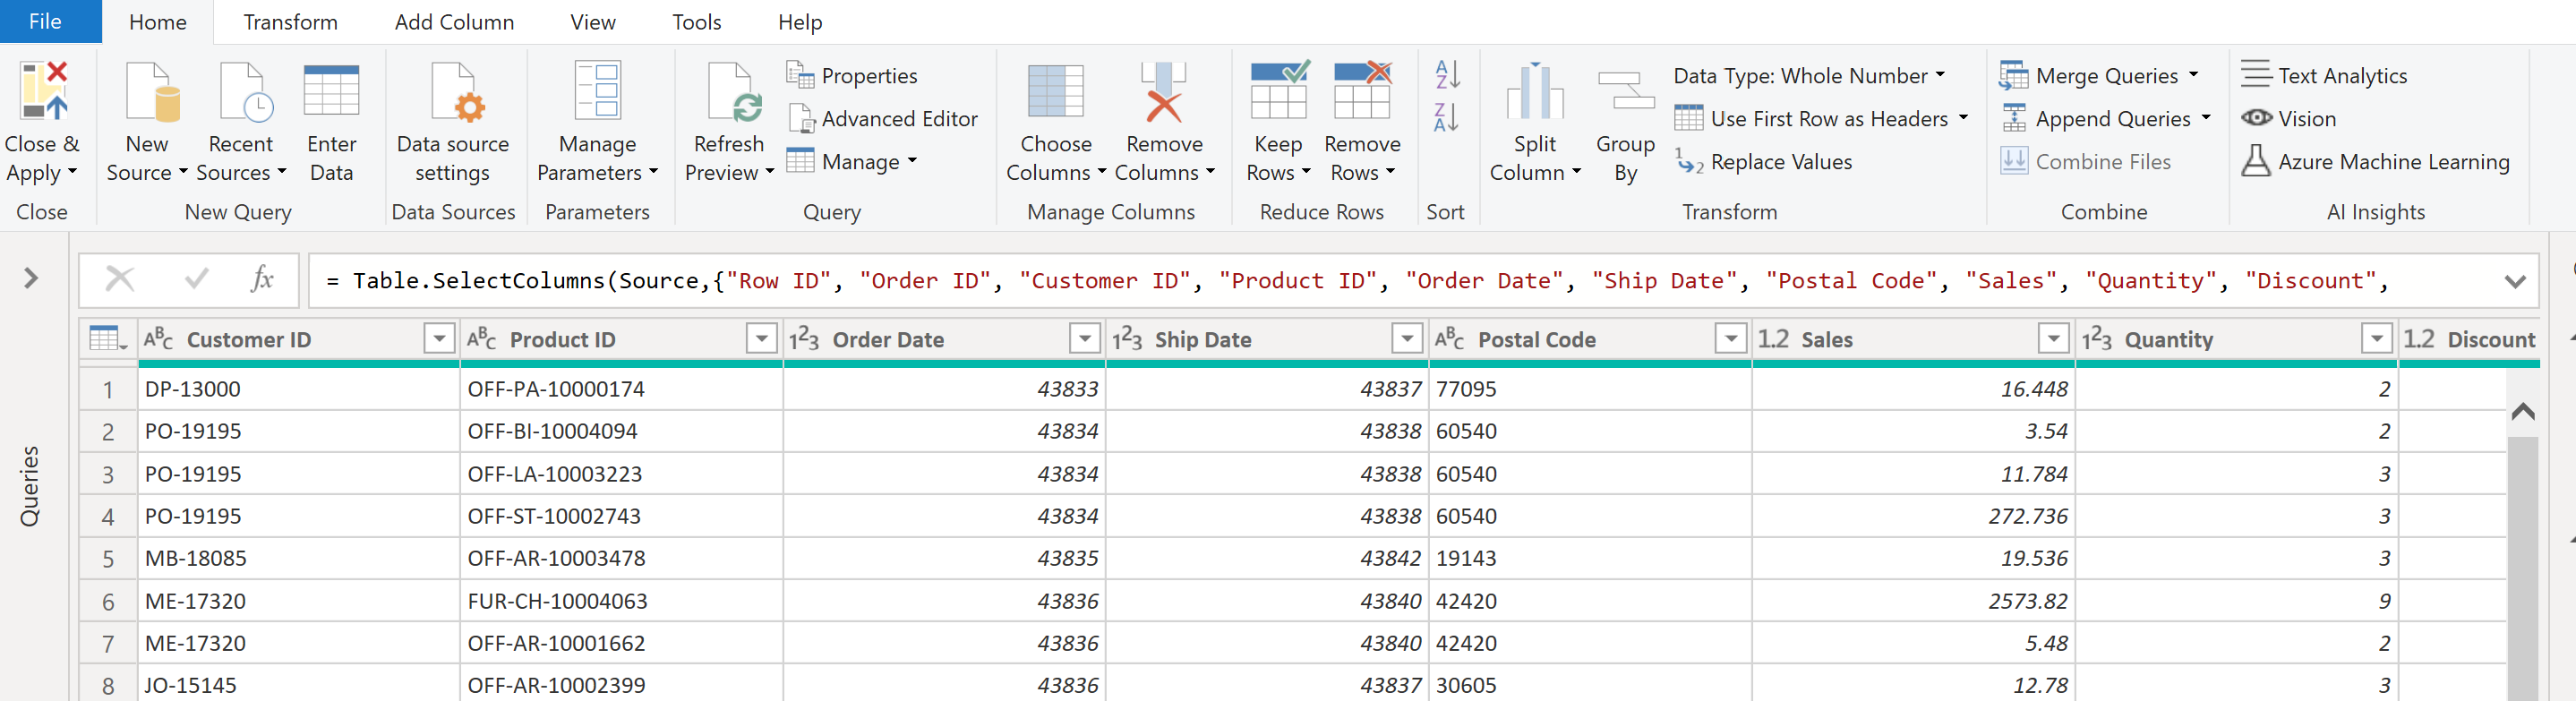
To have a better overview of what each field (column) looks like follow these steps:
Step 1. Navigate to view tab.
Step 2. Tick Show White space, Column Quality, Column Distribution.
Show White Space: Highlights invisible characters like spaces or tabs in your data, aiding in identifying formatting inconsistencies.
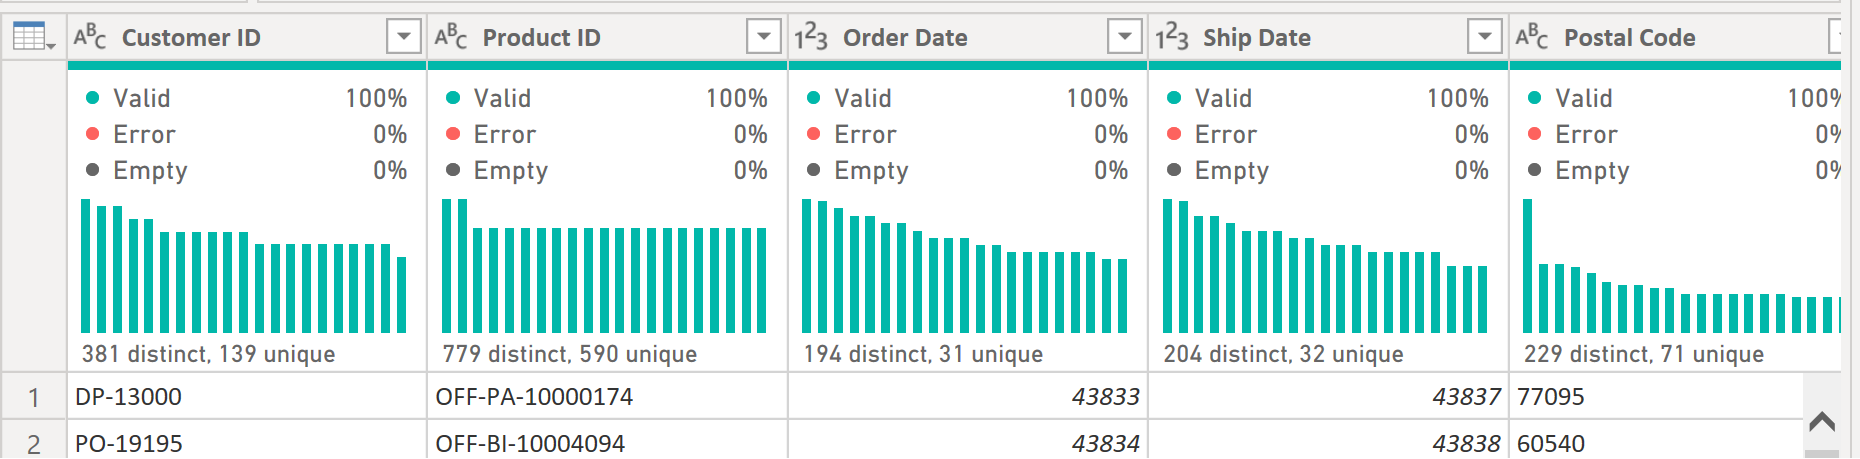
Column Quality: Offers a visual overview of data cleanliness, showing the percentage of valid, error-containing, and empty cells in each column.
Column Distribution: Visualizes the distribution and frequency of unique values within a column, helping to understand data variability and consistency.
Step 3. Important Step. Ensure you have selected to work with entire dataset to get full information on your view. You can find this at the bottom of your screen.
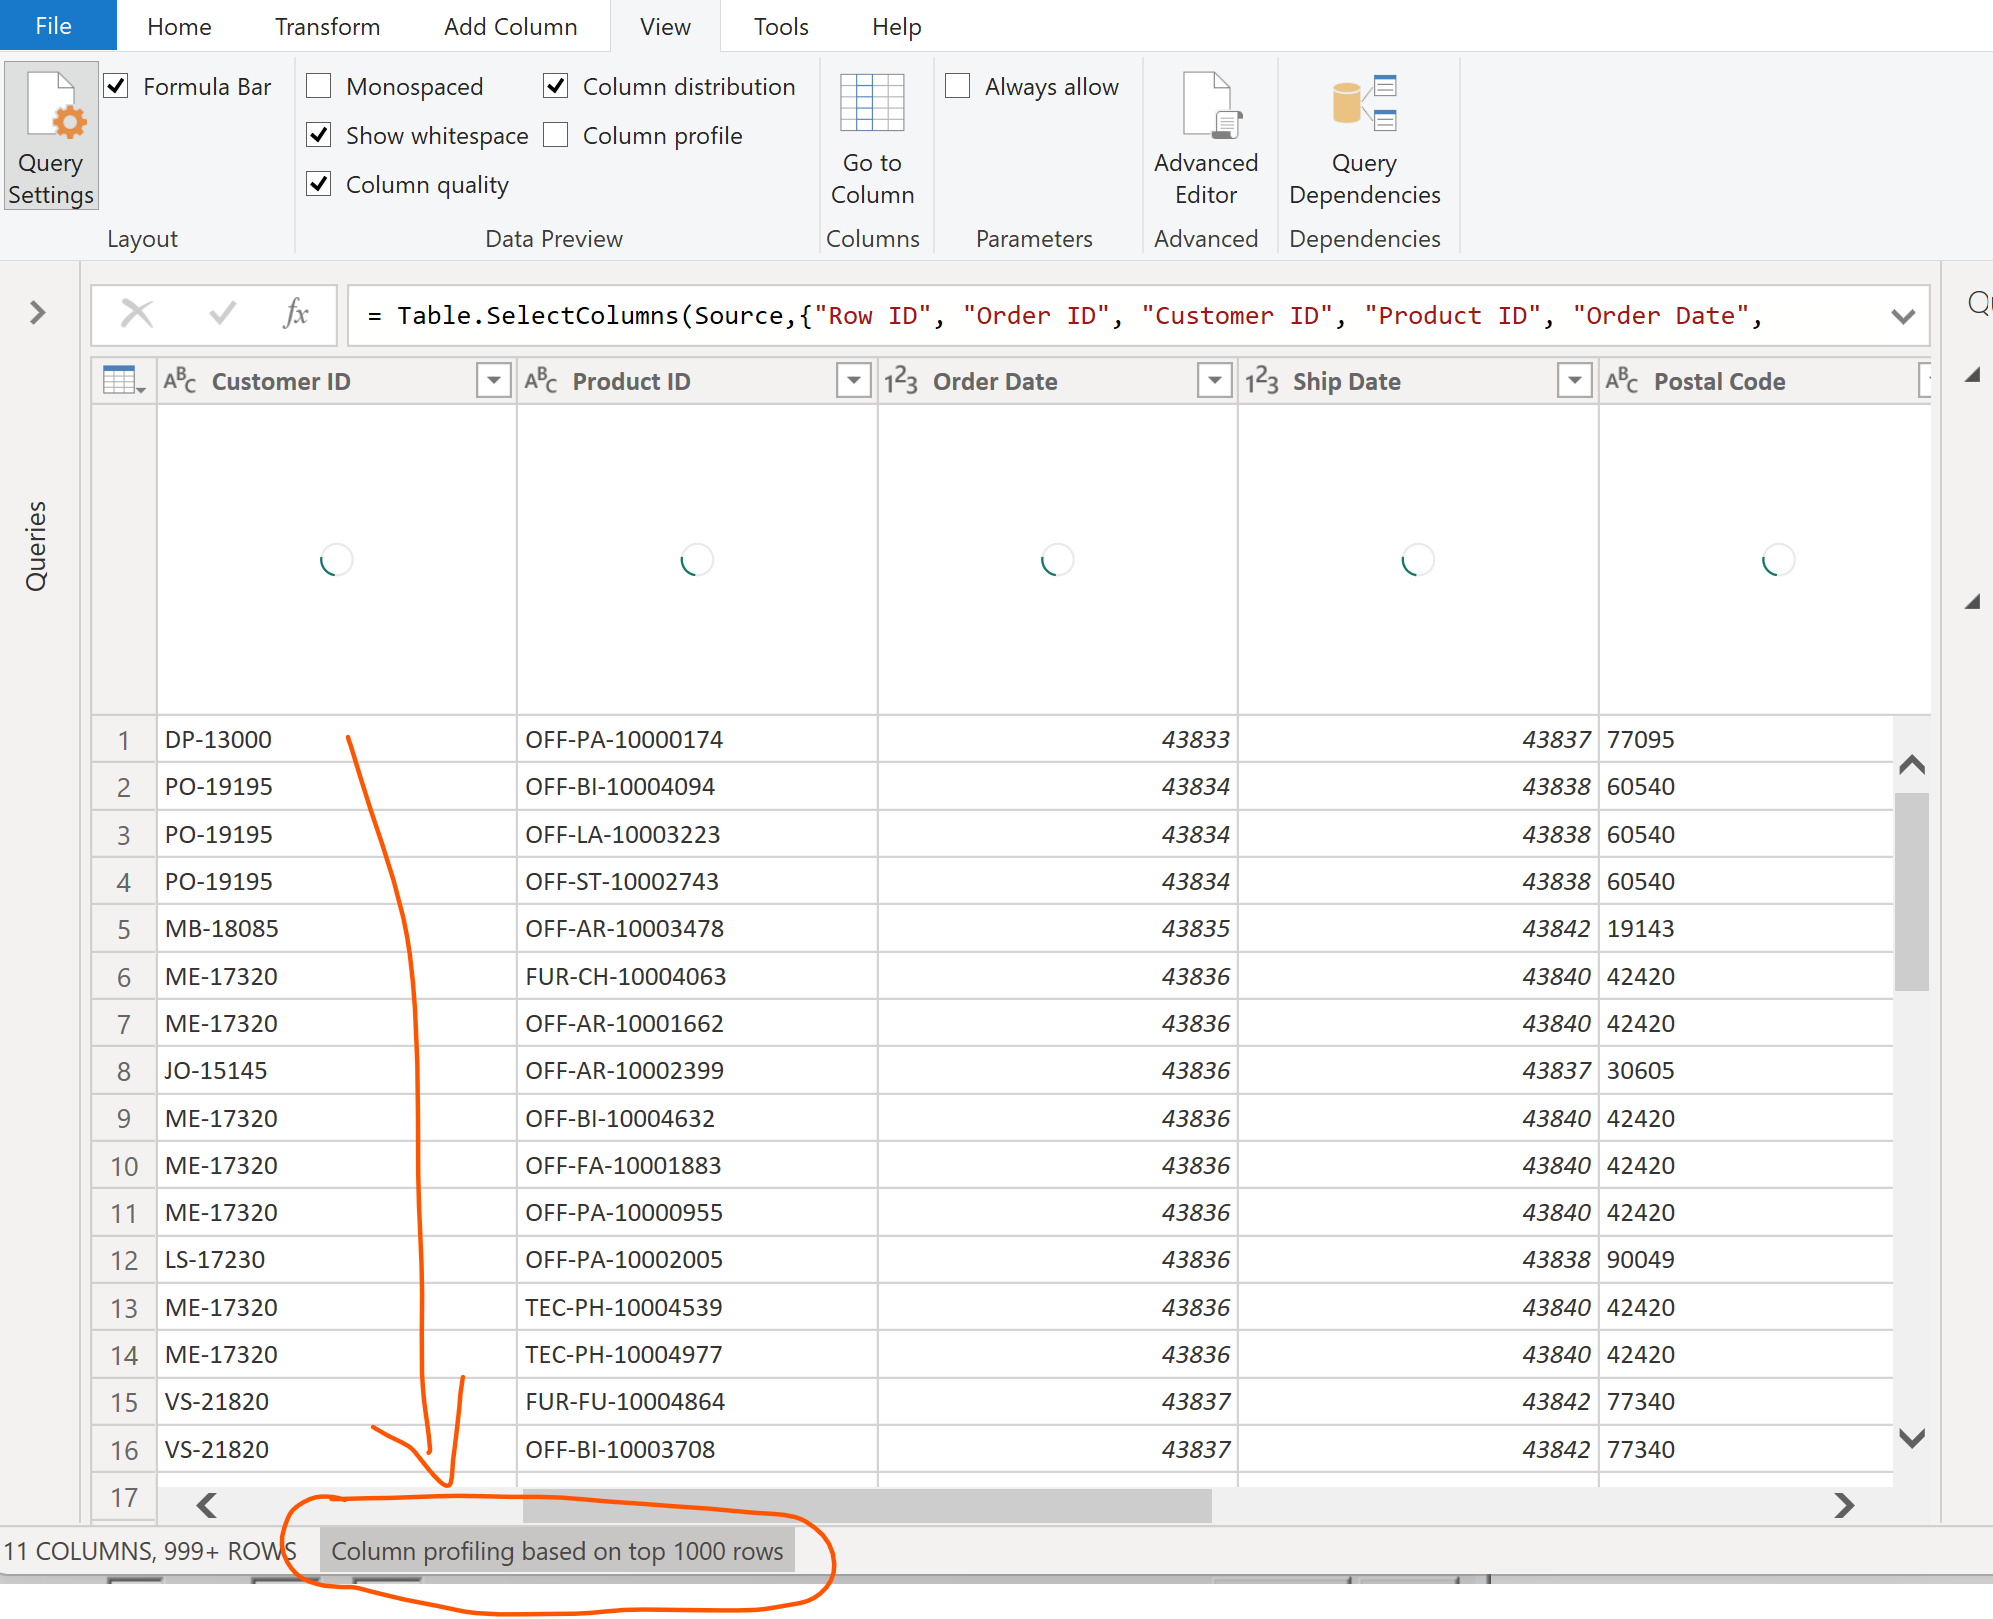
Now you should see results based on all of your data