Similarly to my previous post on drilldowns, this blog is also going to be a guide for showing you how you can dynamically drilldown bar charts in Tableau. The difference is, this time, instead of using Sets, we'll be looking at how we can use Parameters to execute the same action. Once more, I will be using Category and Sub Category dimensions from Sample SuperStore as the example for this guide.
Step 1: Identify hierarchy and lay out your dimensions and measures
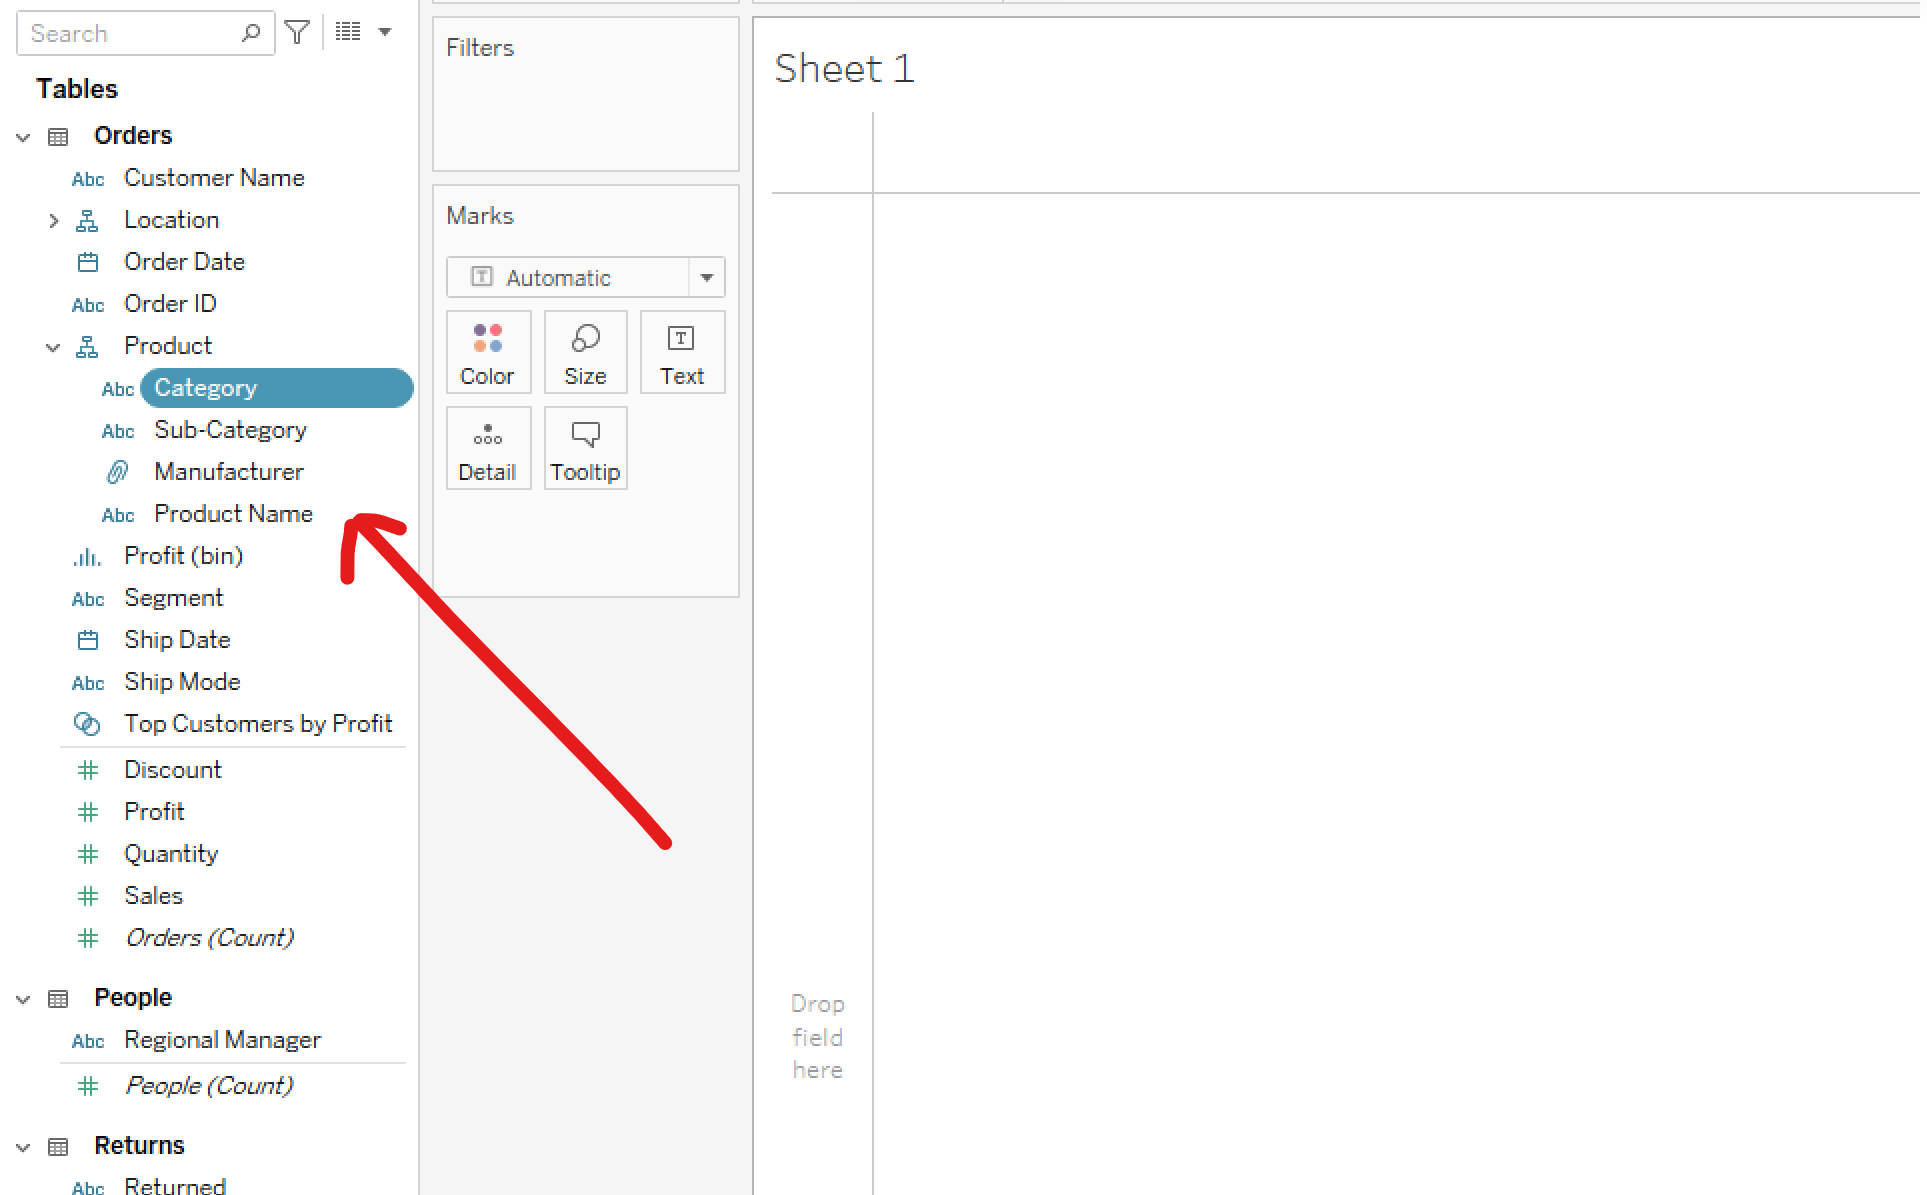
The first step to any chart crafting will always be conceptualizing what you are trying to achieve. You'd want to make sense of the hierarchy of dimensions you want to drilldown. In my case, the name of my hierarchy is "Product". Within it contains "Category" at the highest level, "Sub-Category", "Manufacturer" and "Product Name" at the lowest level.
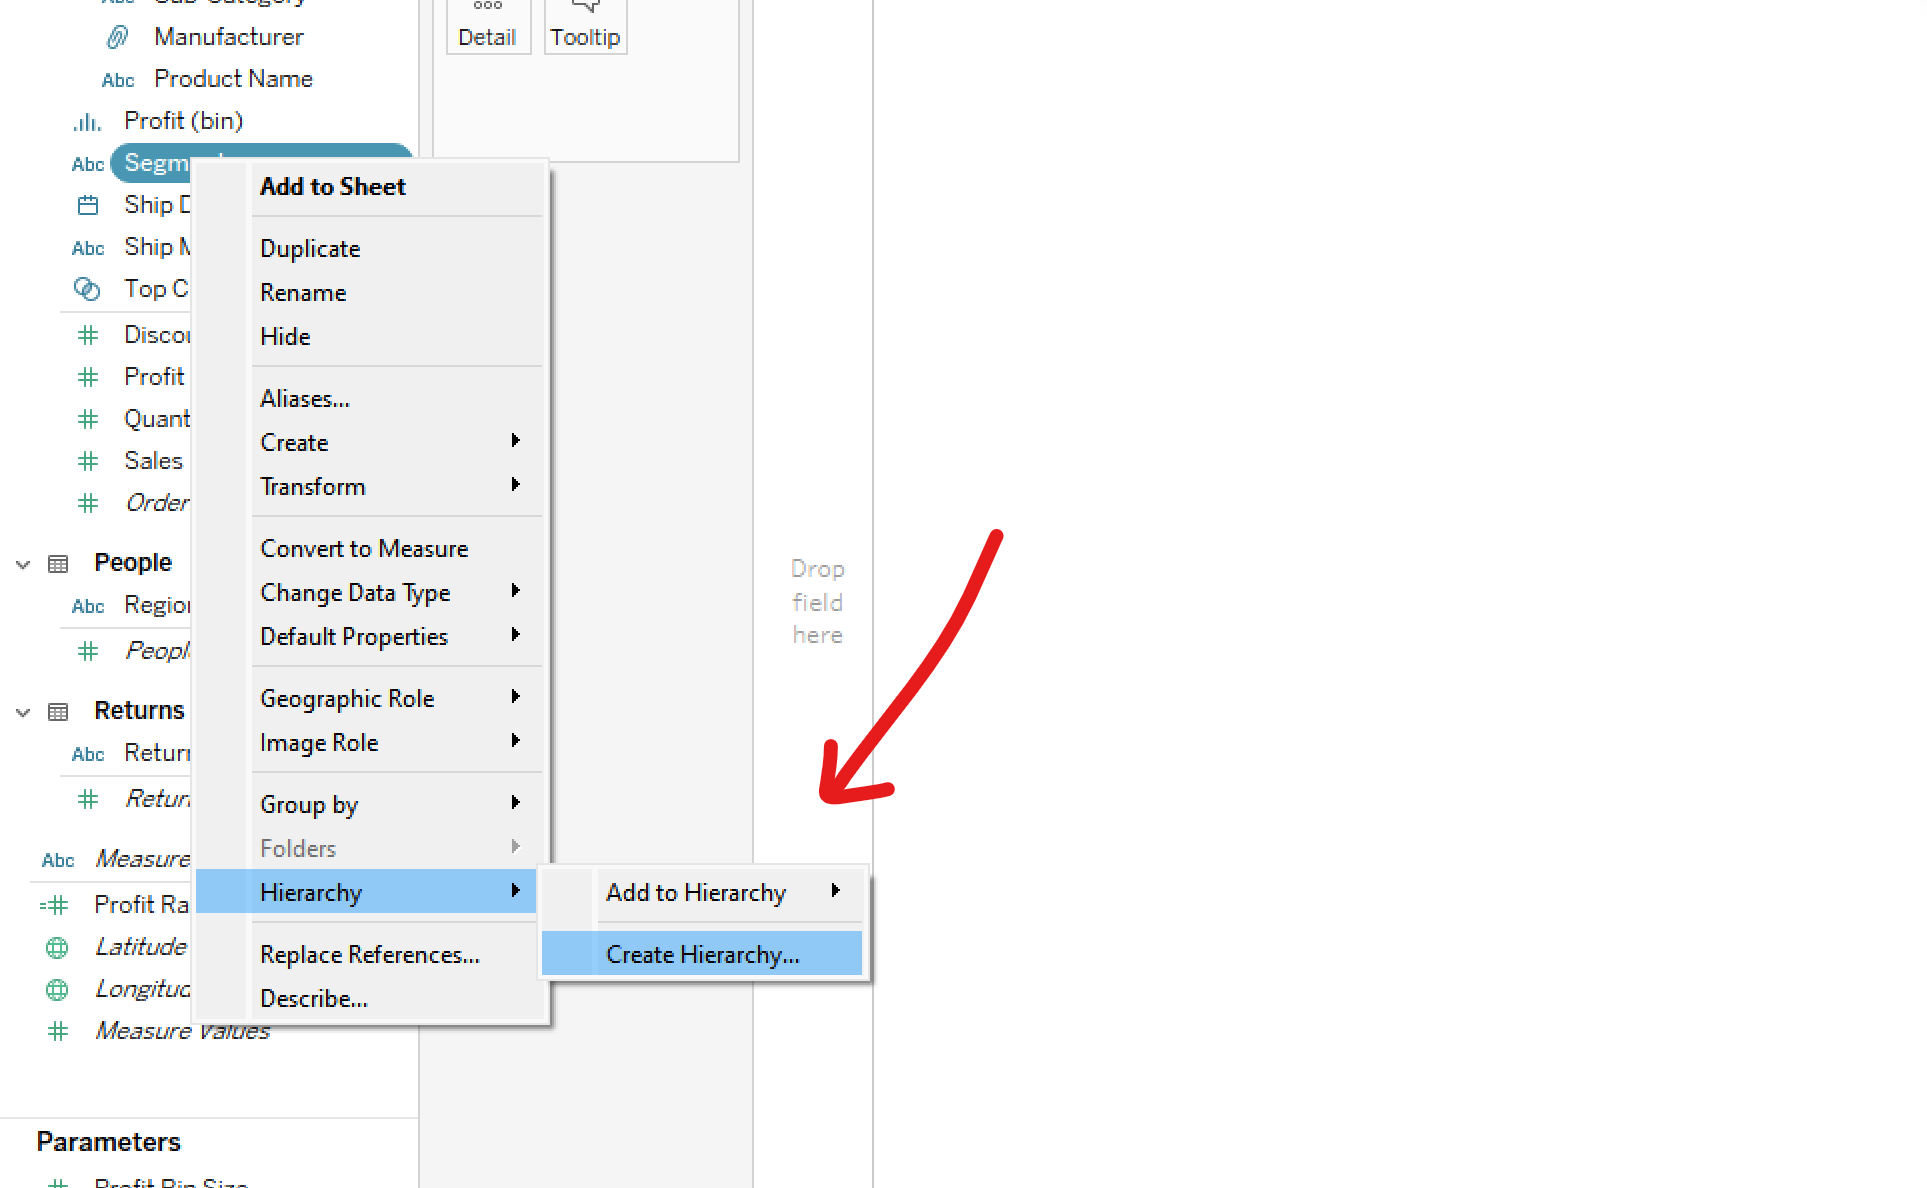
Note that you can create your own hierarchy by right clicking on a dimension and Select "Create Hierarchy" under the "Hierarchy" tab.
Step 2: Creating a parameter and making sure it works as intended
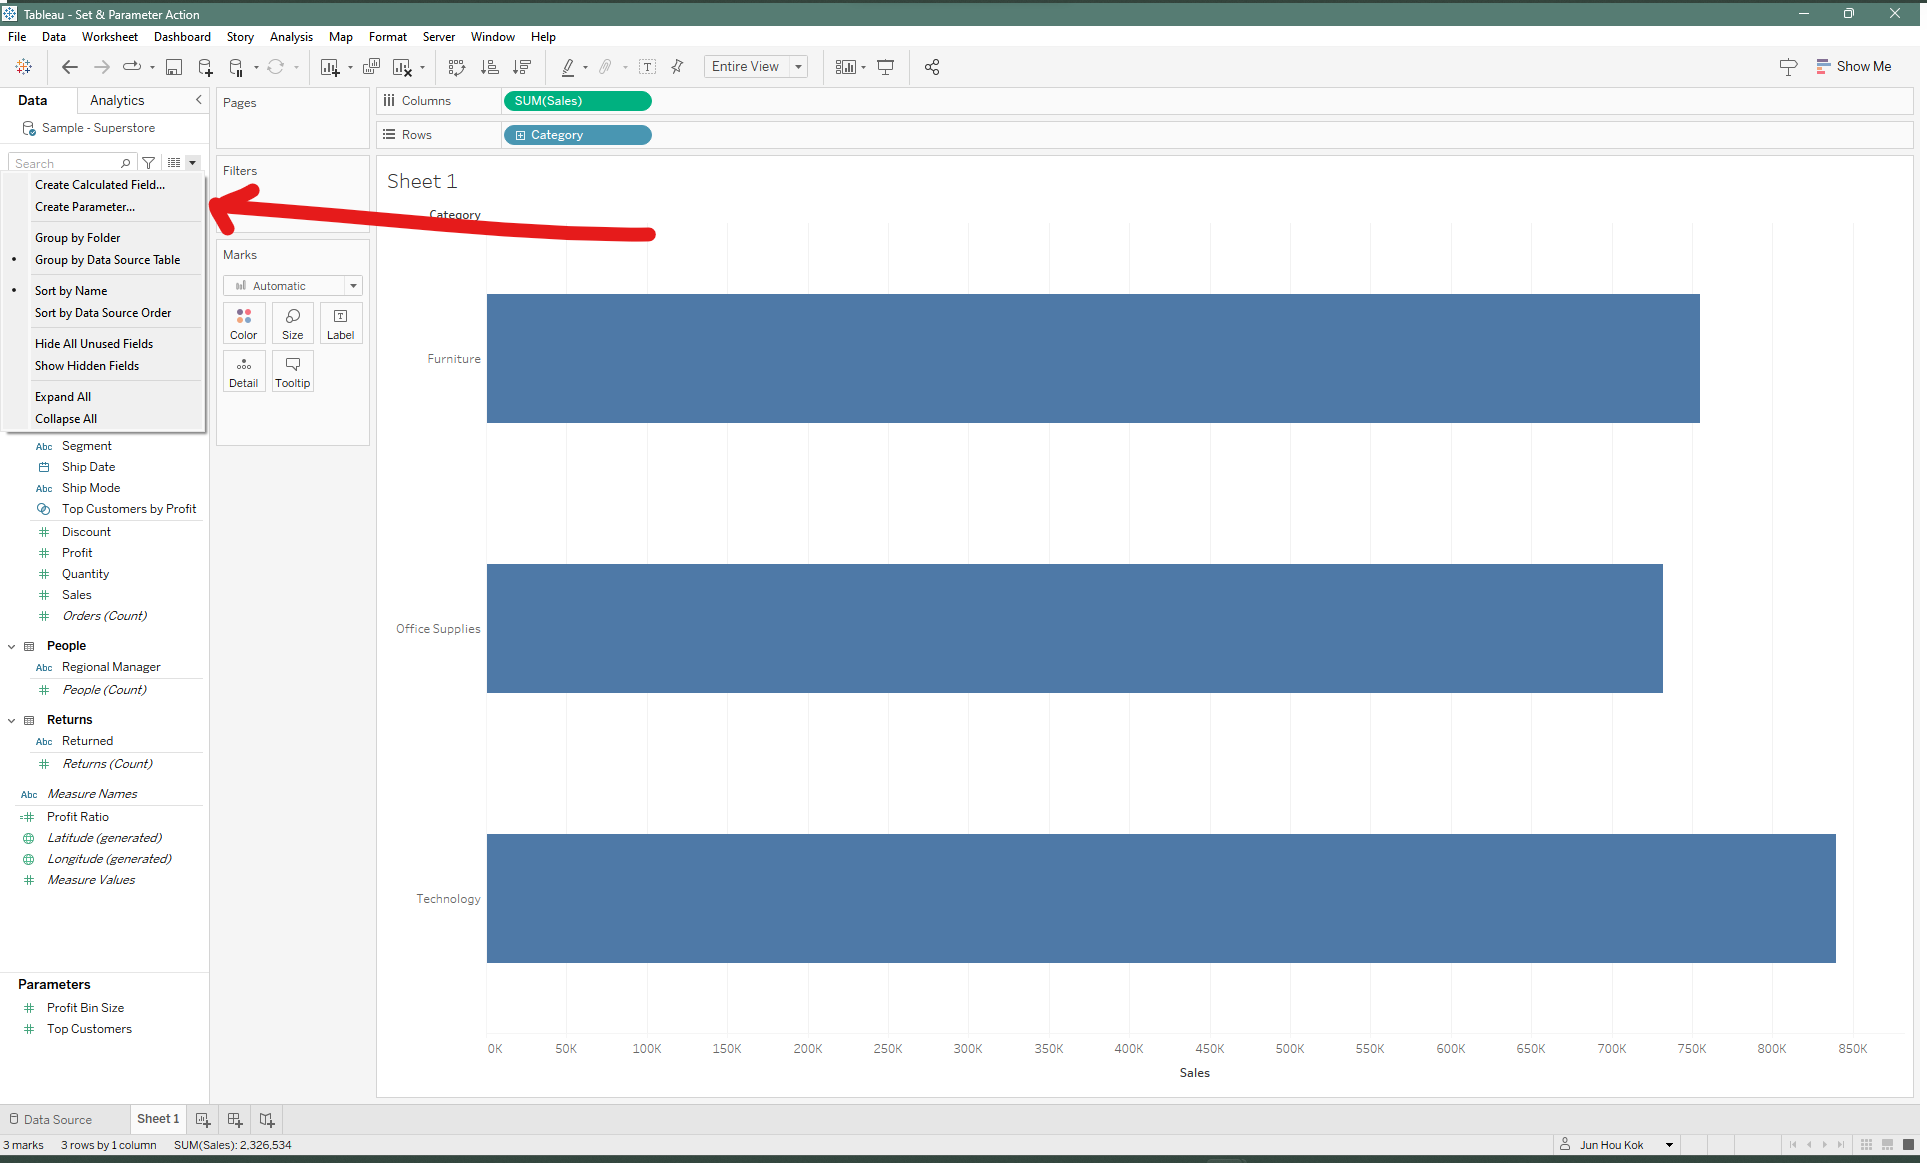
Now that you have an idea of what needs to go where, we'll start making a parameter. With a parameter, we can easily reference it in a calculated field we'll be creating and utilizing later; it will also be used to change the value of whatever we click on our chart. Create one by clicking on the dropdown icon on the Data pane.
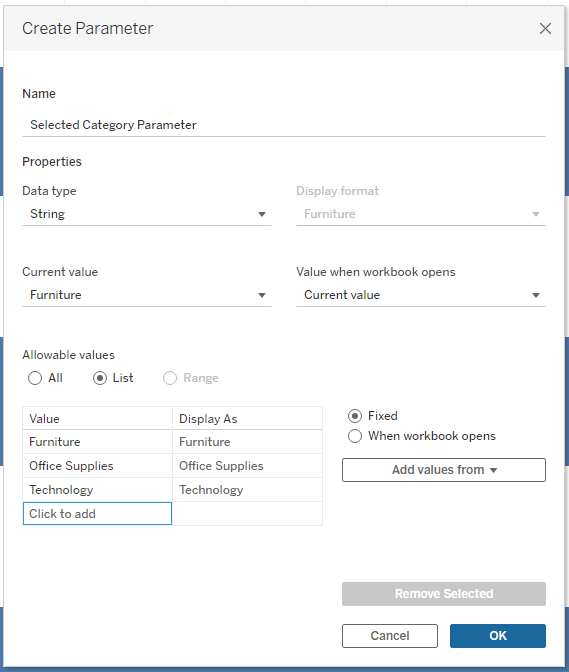
Now configure the parameter so that it can contain the right type of data we want it to contain. I've named my parameter "Selected Category Parameter", changed the data type to "String" since the values within "Category" are words, and finally I've selected the List option for allowable values. Adding values from the right dimension (in this case, Category) would populate the list with all available values from the dimension.
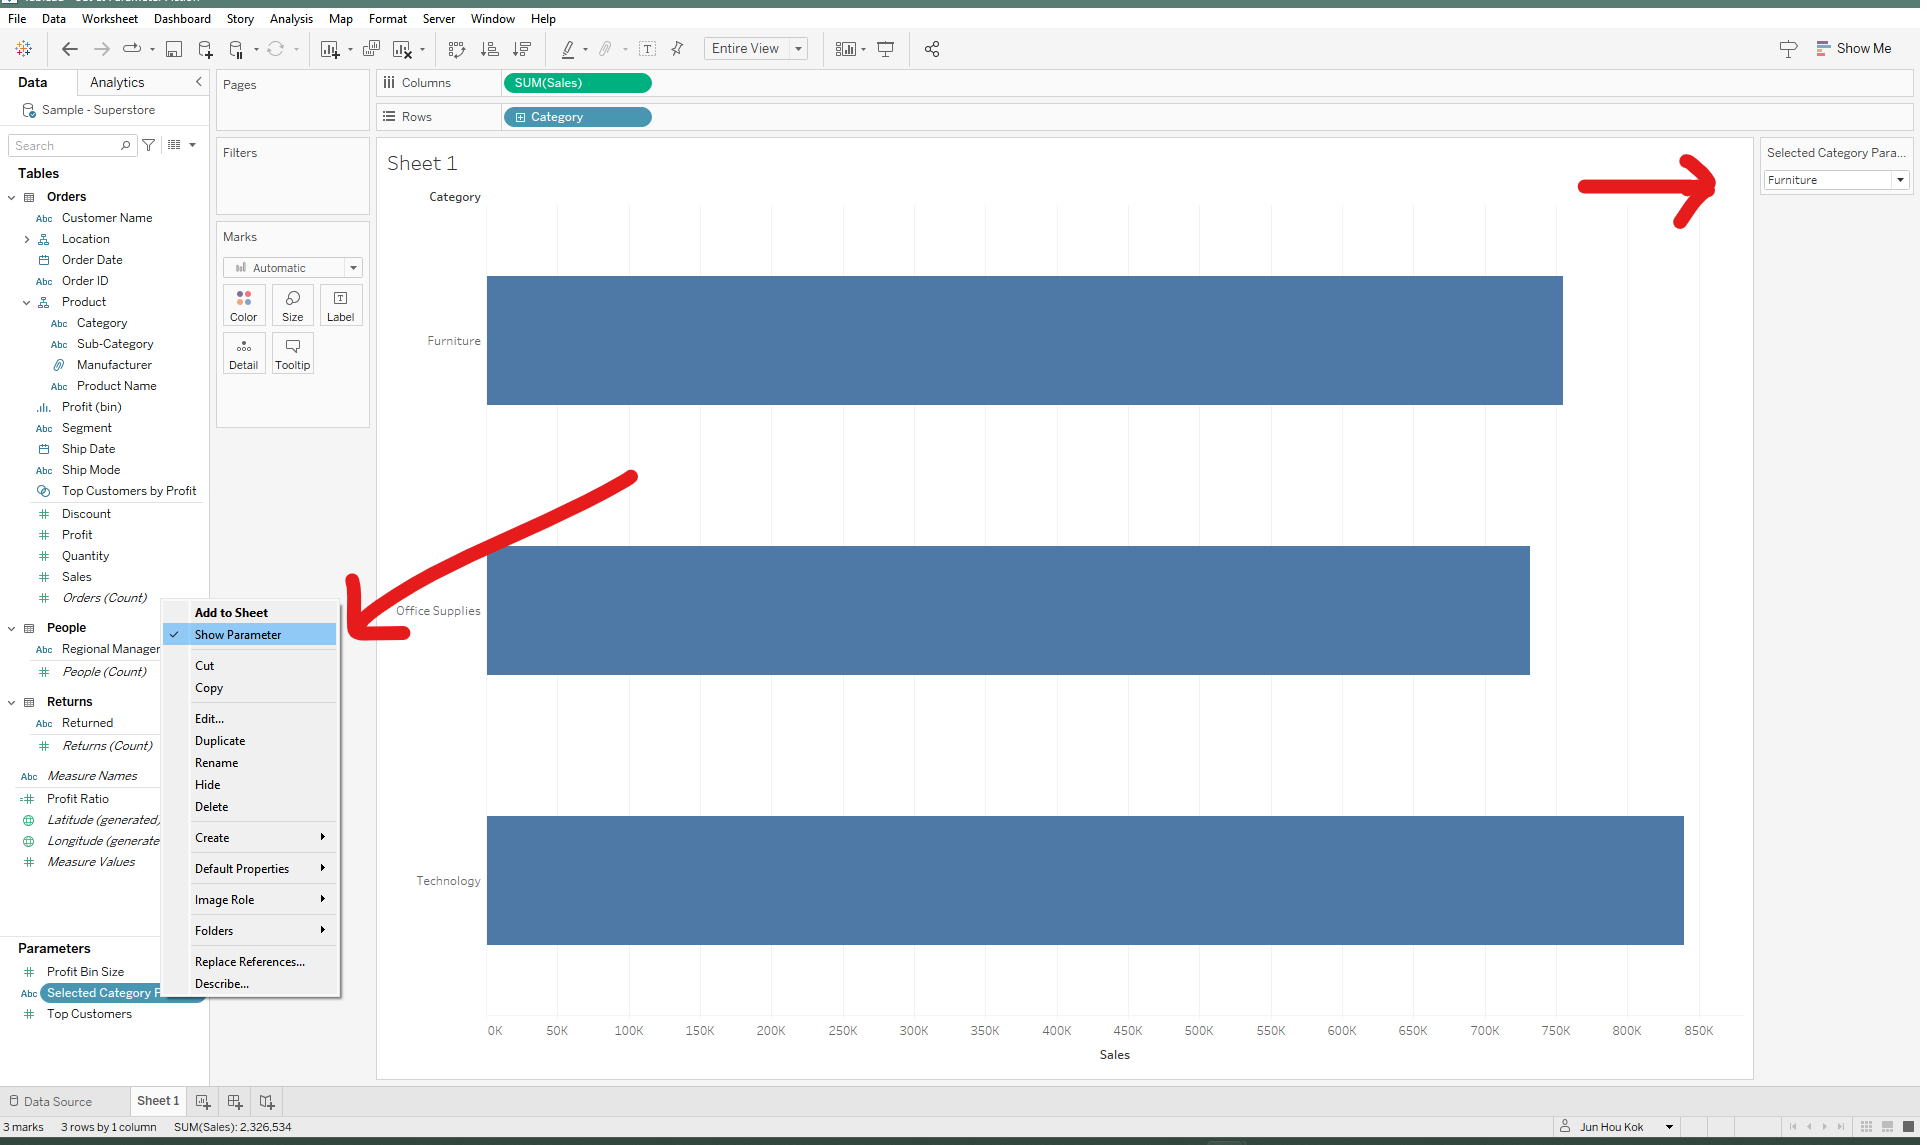
Now that the parameter is created, you can right click on the Parameter at the bottom of your Data pane and select "Show Parameter" so that you can see what the parameter is populated with at the moment. A pop up will show up on the right side of your canvas and you will be able to view and change what the parameter is currently selected on.
Step 3: Set up interactivity/ worksheet action to switch parameter
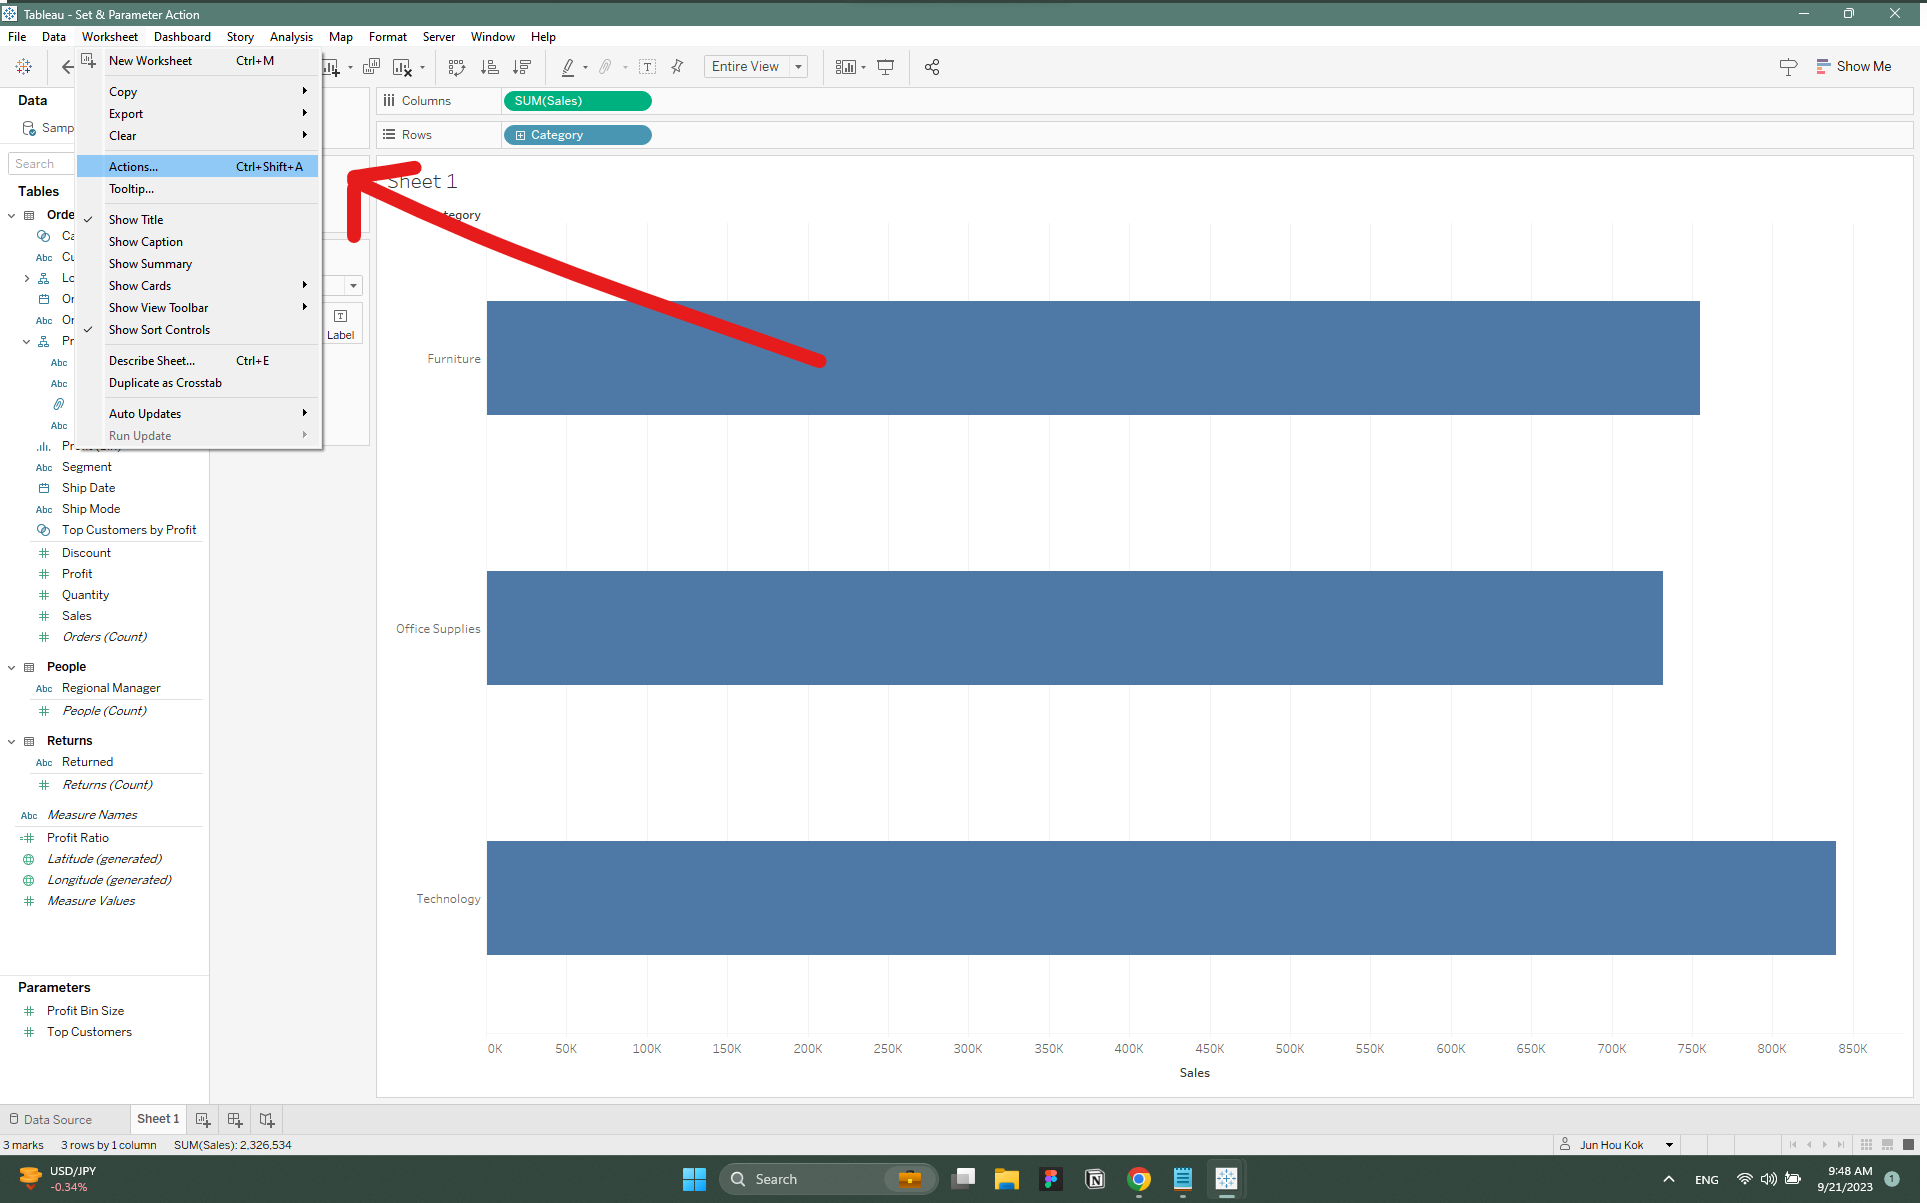
Now that we have the parameter set up, we can set up a worksheet action so that we can dynamically switch what the parameter contains instead of just using the selector pop-up on the right. You do this by clicking on "Actions" under the "Worksheets" tab on the top ribbon; it is also instantly accessible when you use the keyboard shortcut ( Ctrl + Shift + A ).
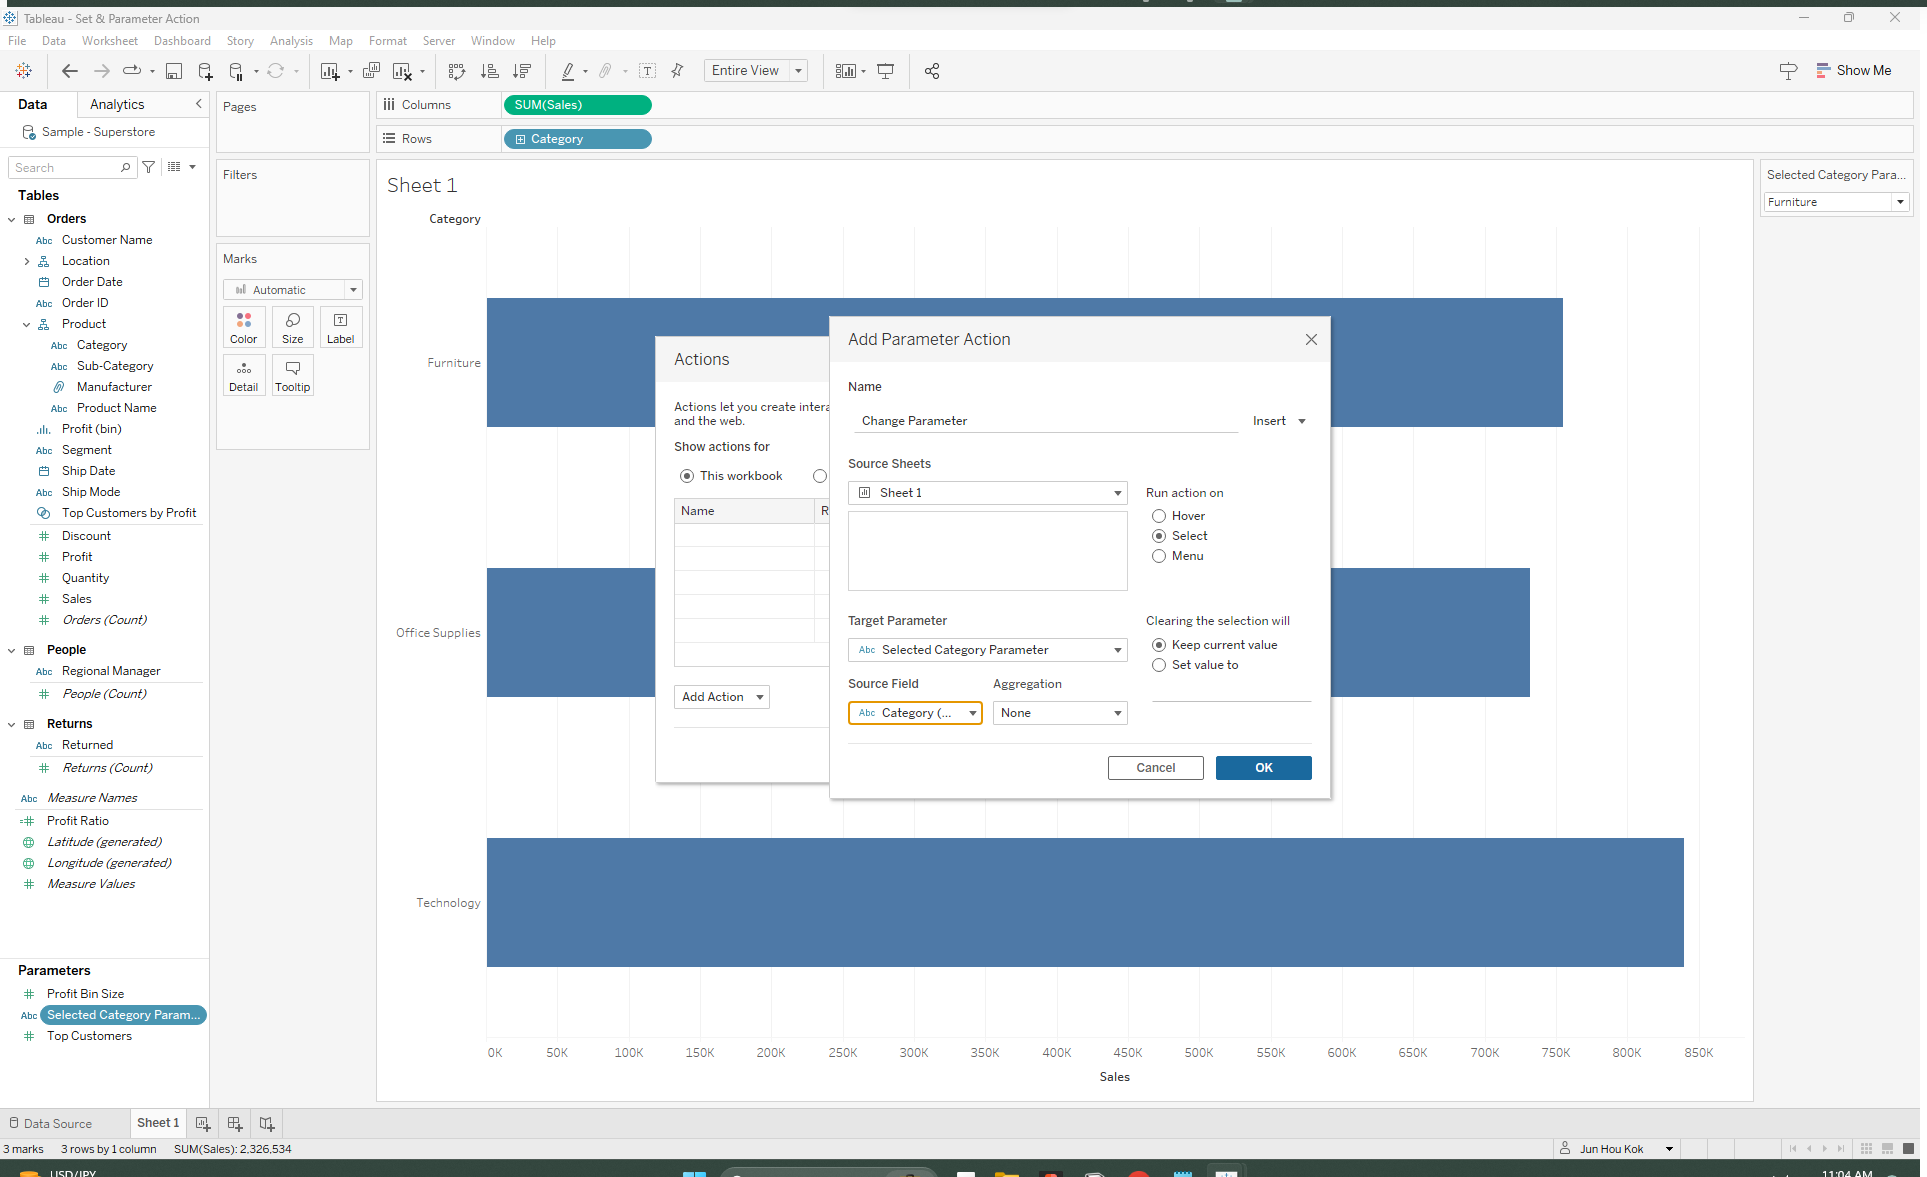
After you've selected Actions, a pop-up will appear. Select "Add Action" and click on "Add Parameter Action". You would want to configure your parameter so that it changes value when you click on the corresponding element on your chart.
I've named my parameter action "Change Parameter". On select, it will target my "Selected Category Parameter" parameter using the source field "Category", and by clearing my selection, it will keep the current value on view.
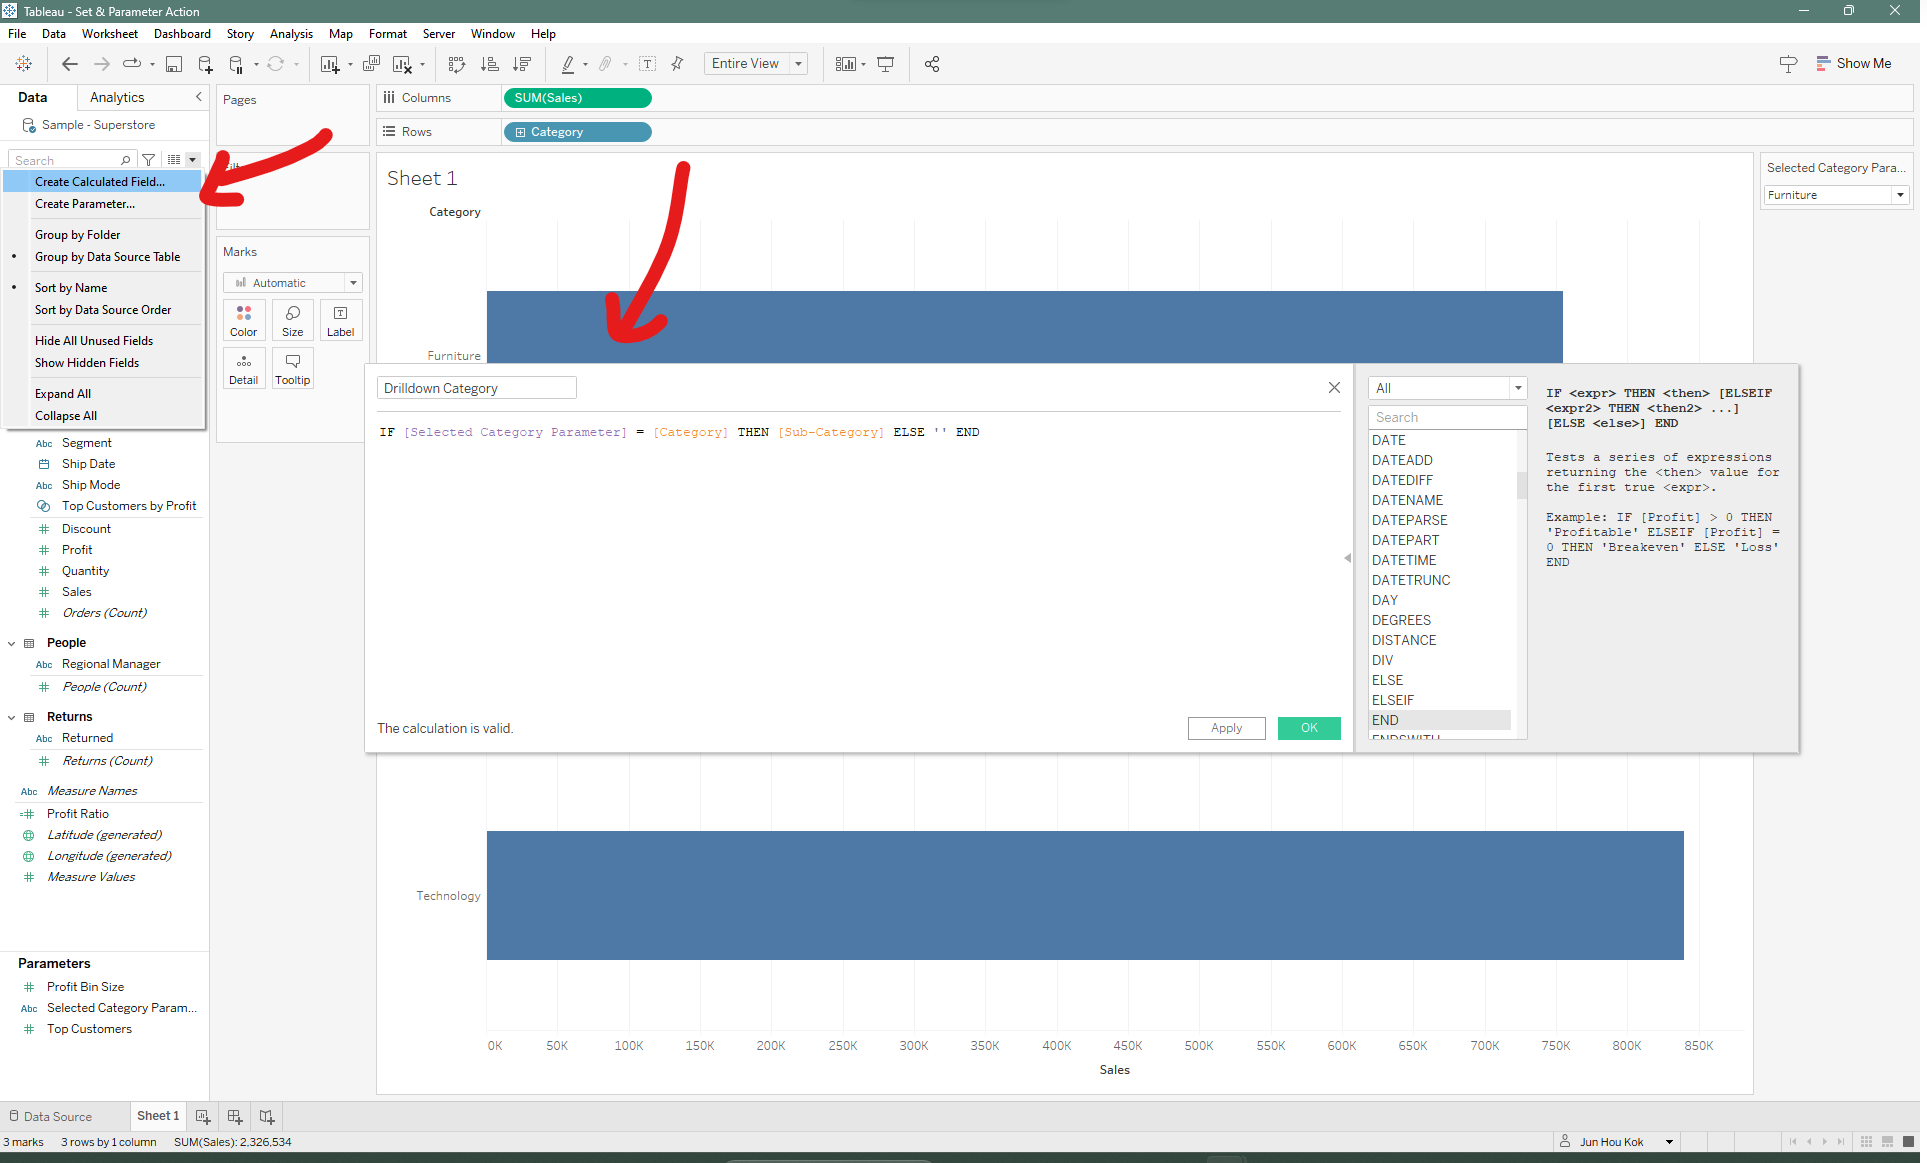
Step 4: Set up a calculated field and finalize the dynamic drilldown
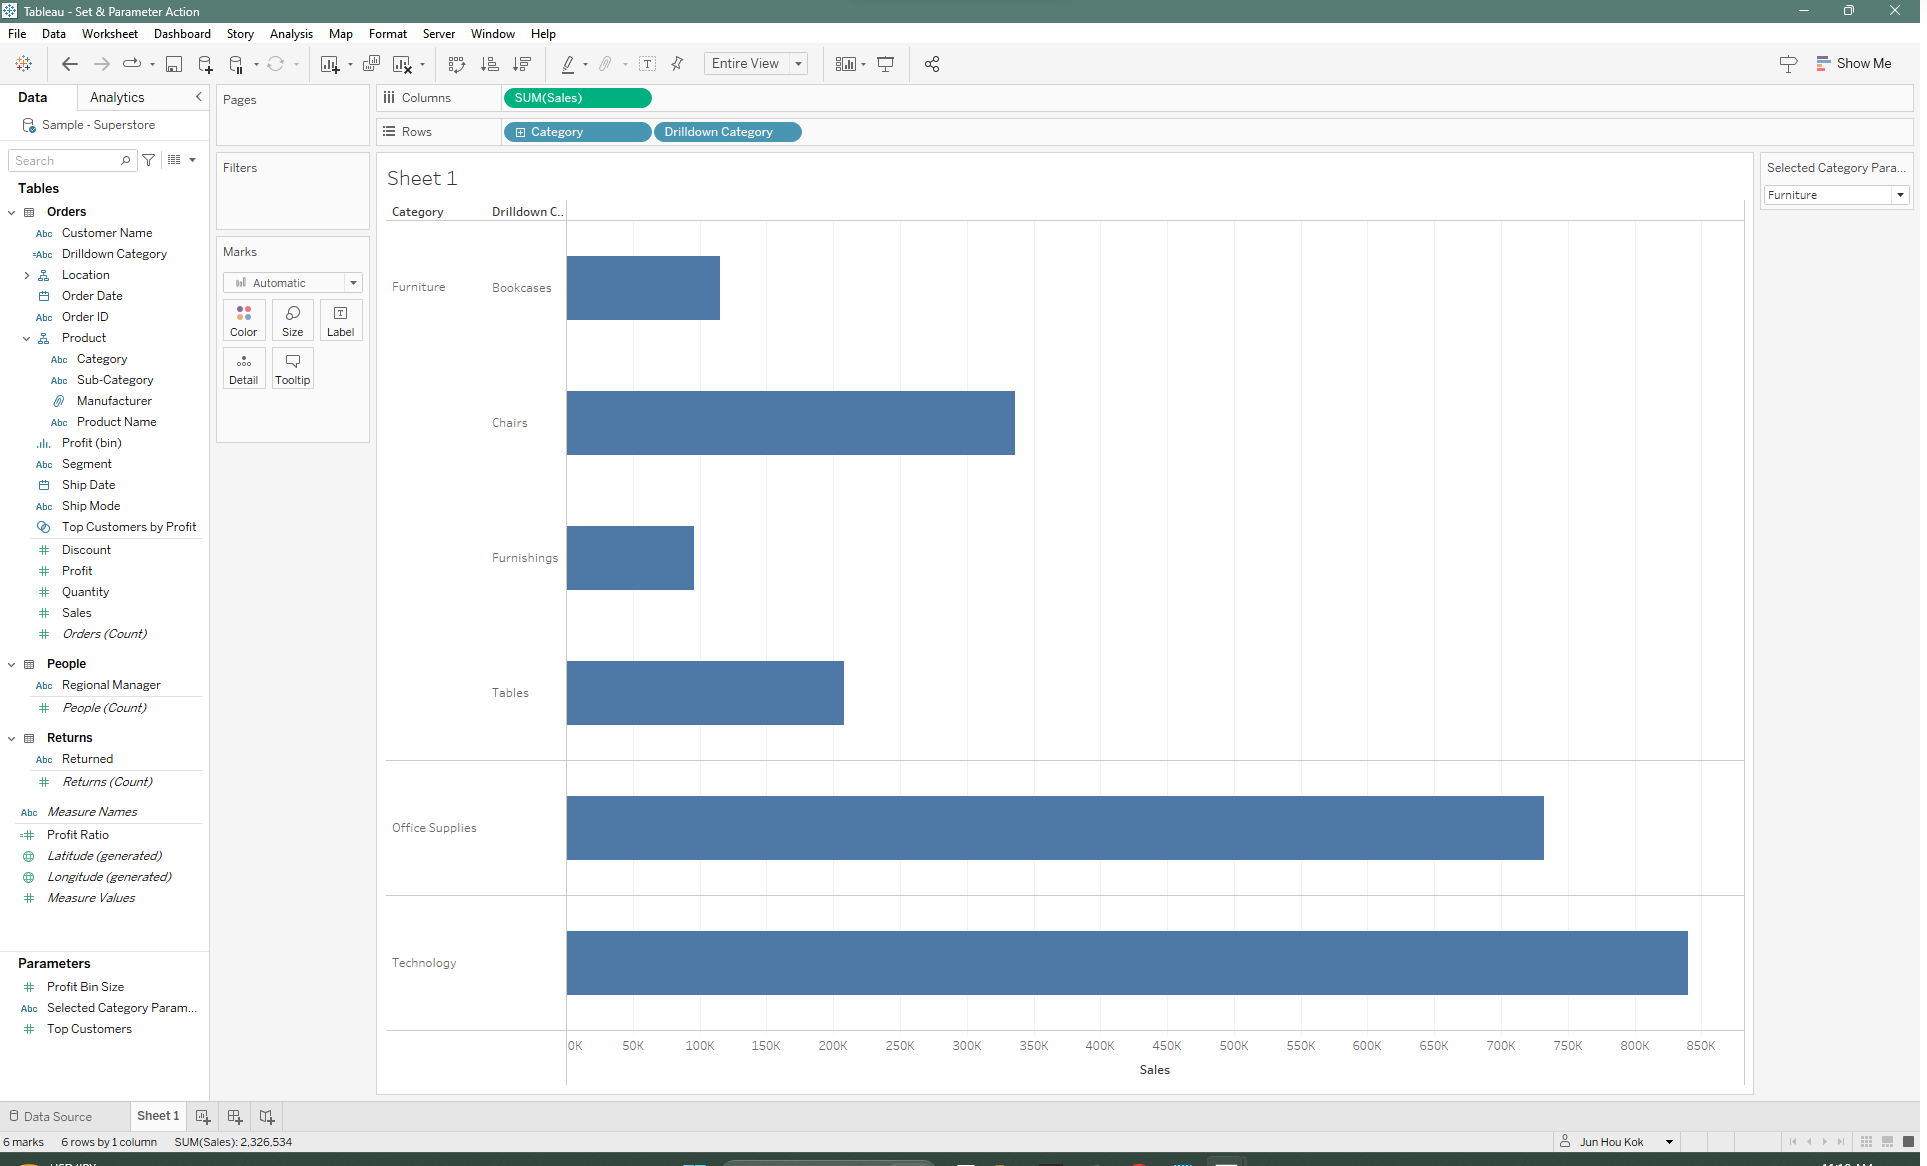
With our parameter action done, we can now make a calculated field that controls the drilldown. Here I've used an IF statement that says: IF [Selected Category Parameter] equals to the Category populating our parameter, then show me its subsequent sub-category, ELSE show me nothing END.
Drag the newly made calculation into Rows and you should start seeing the drilldown happen.