As promised, this is a bonus blog post following the Tableau Conference 2024 session: Vanguard Case Study: Enhancing Cloud Insights with Tableau.
Check out our deep dive into how we prepared our site and data to create the solutions shown at TC 2024

Are you looking for a way to leverage Tableau Cloud Admin Insights data sources to create a dynamic engagement dashboard? Look no further than this blog post!
In this post, we'll do a deep dive into how I prepared the data to track, monitor, and govern our Tableau Cloud site. By integrating HR data to understand user demographics and structuring project folders to represent stages of the development lifecycle, we can gain valuable insights into user behavior and uncover data about our Cloud environment accordingly.
Step 1: Determining which Admin Insights data sources to use
TS Events - contains data about the events occurring on your site, including sign-ins, publishes, and accessed views.
TS Users - provides data about users, such as license type, last log in date, content ownership.
Site Content - has data about dashboards, data sources, and workflows on the site. This source has information about view names, workbook names, project names, top parent project name.
Groups - contains data about the group membership of a user, showing what user access a user has on our site.
There are other data sources such as: Viz Load Times, job Performance, Permissions, Subscriptions, and Tokens. At this point, our team does not use these data sources, but feel free to read more about them to see if they suit the needs of your team.
Step 2: Prepare your site for custom analysis
Re-structuring project folders
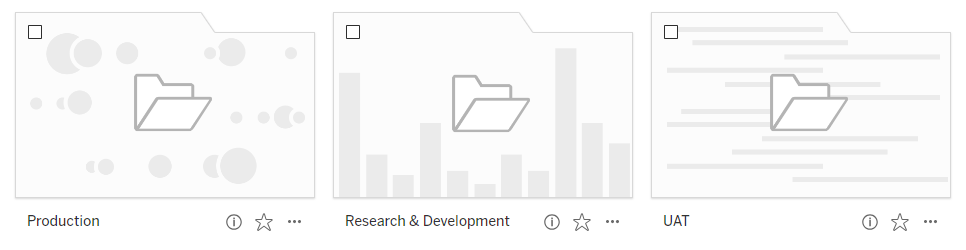
We prepared our Tableau Cloud site for custom analysis by structuring project folders to mirror the three stages of the dashboard development lifecycle: research and development (R&D), user acceptance testing (UAT), and production. By creating distinct folders for each stage, product owners establish a streamlined framework for tracking the journey of a dashboard from conception to deployment. This approach not only fosters organization and clarity but also enables seamless monitoring of dashboard progression through the development lifecycle.
Administrators and developers can now easily access the evolution of dashboards, identify bottlenecks, and ensure alignment with project timelines and objectives. By assigning a project folder to a names stage of development, we can now see this in the Admin Insights data in Site Content through the Project Folder fields. Because we can filter dashboards based on project name, the naming conventions are now more meaningful.
We can also leverage the project structure by assigning specific group roles to each project folder, enabling control over access permissions. By tailoring access to match the needs of each stage in the development lifecycle, we ensure that stakeholders have the appropriate level of visibility and engagement throughout the project journey.
For those on smaller Cloud sites, there is a field to use in Site Content called "Top Project Folder" and simply making these folders at the top of the hierarchy will be straightforward. However, on my team we share the site with multiple other departments. Our department's usable Tableau space is already nested under a department top project.
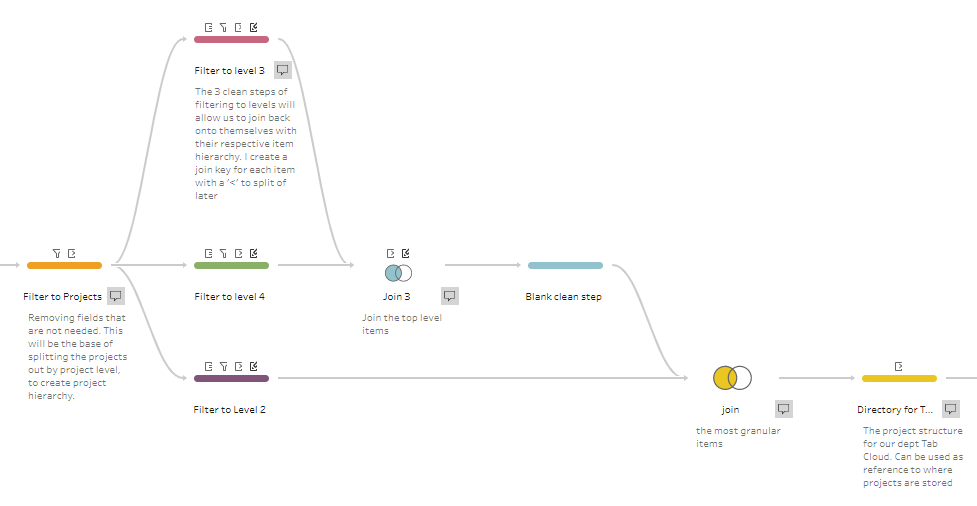
We encountered the challenge of organizing Tableau Cloud projects with various hierarchical levels and parent folder names. One row of data provided a project name, a project level, and a parent project name. To streamline the hierarchy for analysis, we filtered the data to isolate projects at each level. Then, we reconnected these filtered subsets back into the main dataset. This process ensured a clear view of project relationships while preserving the hierarchy. The new row of data was now structured with new columns to look like this: Top Project -> Project Level 1 -> Project Level 2 -> Workbook -> Dashboard.

Adding in dashboard metadata with Excel
Now that we were able to easily identify a dashboard throughout the development lifecycle, we were now able to add in extra information about a dashboard.
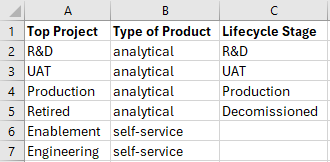
We created this Excel to be able to quickly filter to our site's analytical products only. We also use our site as a self-service tool and need to be able to monitor the usage of that alone. As our site gets bigger, this will be a great tool to organize the types of products and different ownerships that are hosted on our site.
Step 3: Cleaning, joining, restructuring the data with Tableau Prep
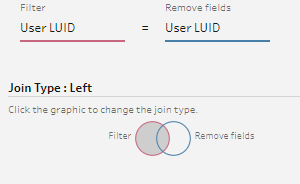
Joining Admin Insights data sources in Tableau Prep is key to getting meaningful insights from Tableau Cloud data. It's like fitting puzzle pieces together to see the bigger picture. In this guide, we'll explore the basic join conditions needed to make sure our data fits together correctly.
For our engagement dashboard, we created 2 data sources: site events and groups/users
Making Data Source #1: Site Events
The data source, Site Events keeps track of what each user is looking at in our Tableau Cloud. It gives us insight to which content people are interested in. This helps us make sure our stakeholders are involved in the process of building our dashboards. Site Events not only shows us how engaged users are but also helps make sure our dashboards connect with our audience.
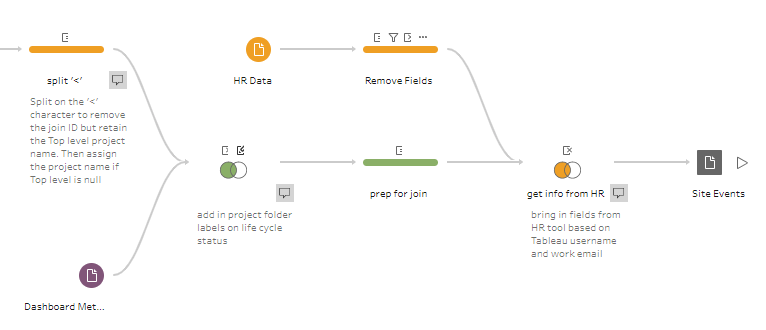
First, we can bring in data sources, Site Content and TS Events. In Site Content, I filtered down to my team's Top Project Folder name so we can look only at relevant content.
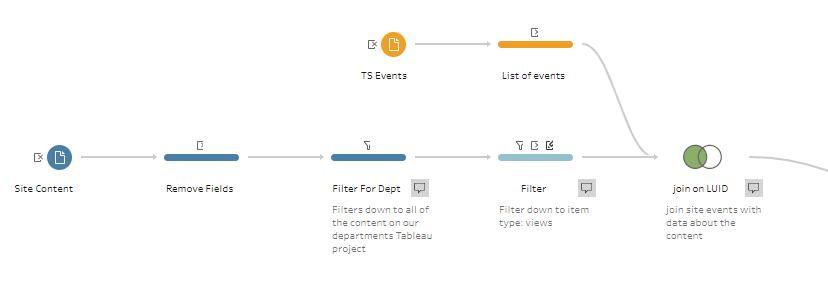
Next, we can now restructure our project hierarchy like I mentioned above. Branching off of site content, you can filter down to your site's project folders and isolate the project levels in their own steps.
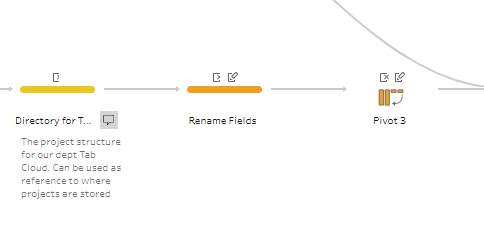
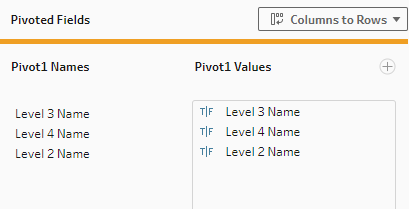
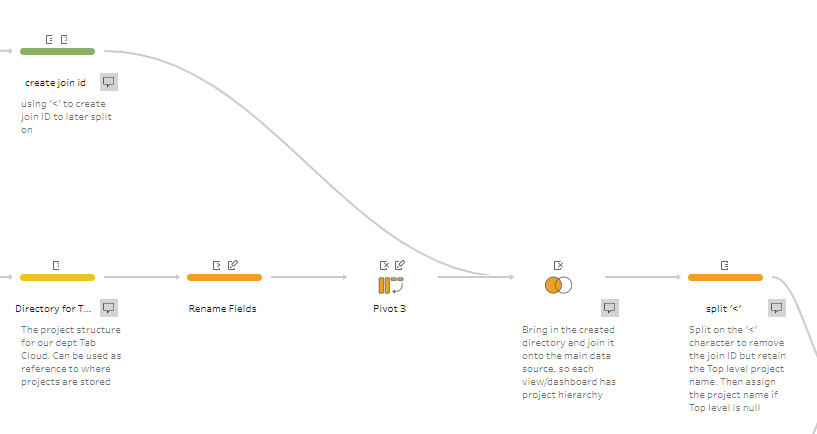
Next, you can pivot the "directory" you created from columns to rows.
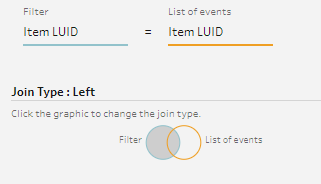
Now that you've successfully restructured your project folders and given a unique join id for the content, you can rejoin back to the main data set, which is the result of the first join in this section.
At this point, we've fully prepared the data. But for our team, we needed a bit more outside information.
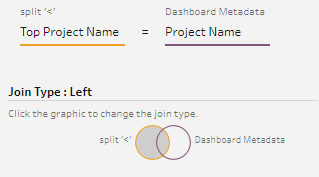
- I mentioned bringing in dashboard metadata. This is just a static excel file that points to the Top Project Name. This additional data set provides essential information about the products hosted on our site, enhancing the depth of detail within our primary data source.
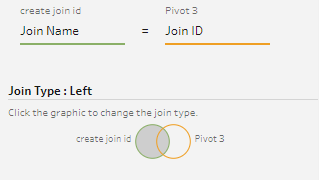
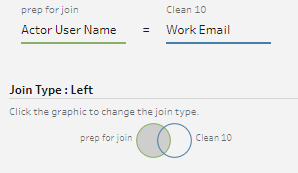
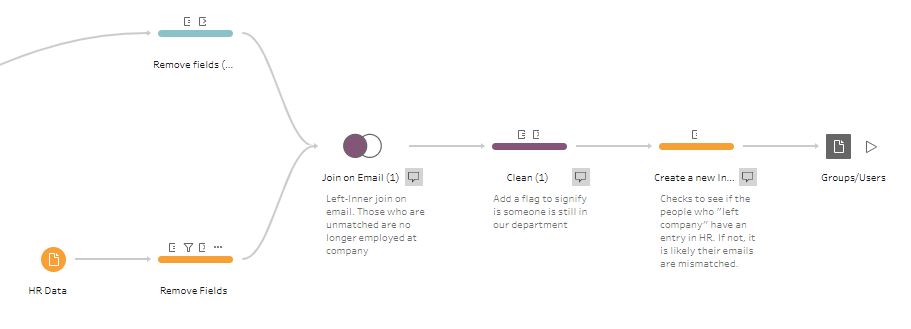
- I grabbed data sources from our organization's HR system that contains information about their department and job role. This information is crucial for our engagement dashboard as it helps us identify our stakeholders and developers. A simple way to monitor end user interactions with dashboards is by using the predefined 'license type' field and filtering for 'viewers.' However, accessing HR data allows for a more comprehensive report, providing deeper insights into user demographics and behavior.
Voila! You finally have your site events prepped for dashboarding!
Making Data Source #2: Groups/Users
In establishing our Groups/Users data source, we compile key information about our site users, such as their departments and job roles. This dataset serves as the backbone of our governance strategy, ensuring that access permissions align accurately with a user's responsibilities. By managing access in this manner, we reinforce the security of our Tableau Cloud environment, mitigating risks associated with unauthorized data access while promoting a seamless user experience.
We manage access by assigning a group to project folders and have specific groups for certain workbooks. This system works efficiently because of our project folder structure. For instance, the dashboard development team has its own group, which is assigned to our Research and Development project folder. However, for a more restricted HR dashboard, special approval is needed. To access it, you'll have to request membership to the group specifically assigned to that dashboard.
First, we will need data sources, TS Users and Groups.
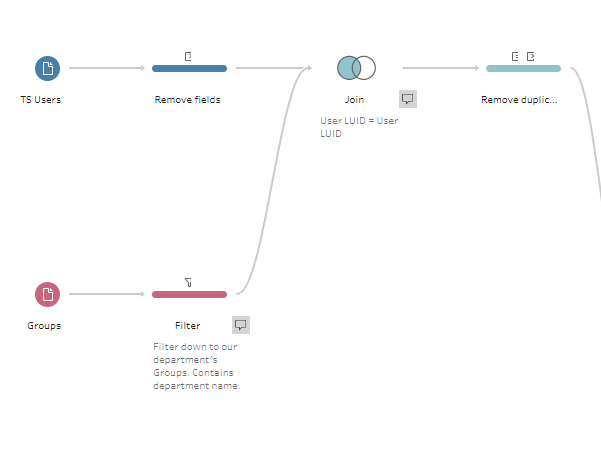
This creates a comprehensive list of your site's users and what access group they belong to. This means you'll have users listed multiple times depending on the number of access groups they belong to. This is why I chose to have 2 separate data sources instead of joining these together.
Again, I wanted to include HR data into this data source. This will allow us to identify people who have access to our site that are not in our department. This will be the building blocks of our access management tool embedded in our engagement dashboard.
In conclusion, we've explored how we can maximize the use of our Tableau Cloud site by using Admin Insights. We've uncovered key strategies to optimize the functionality of our team's engagement dashboard. Throughout this journey, we've emphasized the critical role of proactive monitoring and engagement by leveraging insights from Admin Insights data, HR data, and structuring project folders.
We've created a data-driven culture to empower teams to make informed decisions, enhance productivity, and drive innovation. I encourage you all to maximize the value of all the data assets that Tableau provides, as well as tailoring to the needs of your teams. With customizations like we built into our site, the possibilities of Admin Insights are endless.