Last week at the Data School, we learned how to do Data Scaffolding using Tableau Prep Builder and Alteryx. One of the exercises on the Preppin’ Data blog (Week 3, 2019) already comes with the Scaffold Data set that is necessary for Tableau Prep Builder. What most people in my cohort didn’t know is that in Alteryx, you don’t need to use that Scaffold data. So I decided to write this blog post to explain how you can do Data Scaffolding in Alteryx without the Scaffold data.
I found it quite challenging to explain with short words what Data Scaffolding is, but I’m going to try. Data Scaffolding is a technique used when you have rows of summarised information in a data set, and you need to expand it by filling in rows of missing information to facilitate the visualisation in Tableau. If you didn’t get it, don’t worry, the example below (Preppin’ Data Week 3 ) will make it easier to understand.
Imagine you own a cellphone company, and you have all your clients’ contracts information on a table where you can see when they became a client, how much they pay per month and how long their contract is. It would look like this:

How much revenue are you going to generate from each client?
You can quickly answer this question by multiplying the monthly cost by the contract length, right?
But what if instead, the question was how much is your monthly revenue?
It would be a bit more complicated to answer it, as each contract starts and finishes at different times.
To facilitate the answer to questions like this in your viz, you need to use Data Scaffolding.
Below is the Scaffold data that came in the data set in another tab. The list of numbers is supposed to match the max value of the field you want to scaffold. In this case, the contract length, and the max contract length is 24 months for Carl.

If you are scaffolding in Tableau Prep, you would need to create a “dummy field” so Tableau can join every row of the scaffold to every row of the data, as they have no matching fields that would allow the software to join them automatically.
In Alteryx, you don’t need to worry about it. With only your data set, you can generate new rows to fill in the gaps of information and facilitate your life for visualising your data.
Data Scaffolding with Alteryx
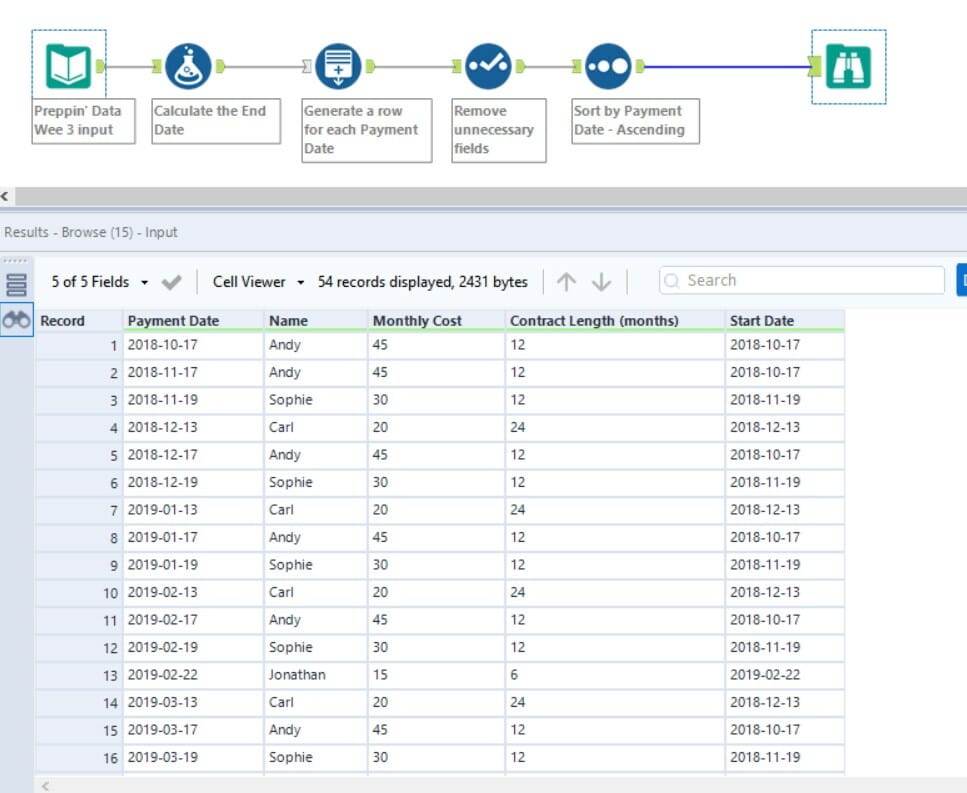
There are a couple of different ways to scaffold your data using Alteryx. The one I particularly liked the most is using the tool Generate Rows. Here is the final view of the workflow:

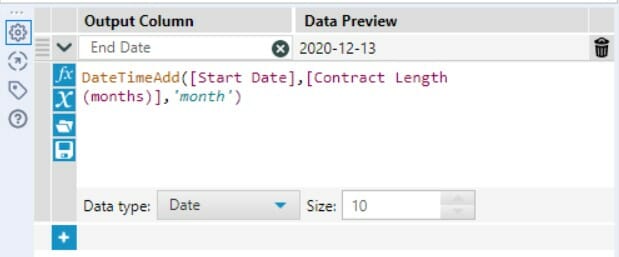
First thing you have to do is to calculate the End Date of all contracts to facilitate the generation of rows for each month that clients will be paying money in. You can do that by using a Formula tool with the following formula:
DateTimeAdd([Start Date],[Contract Length (months)],’month’)

With the DateTimeAdd formula, you are adding the number of months from the Contract Length (months) field to the ‘month’ of the Start Date field. The outcome:

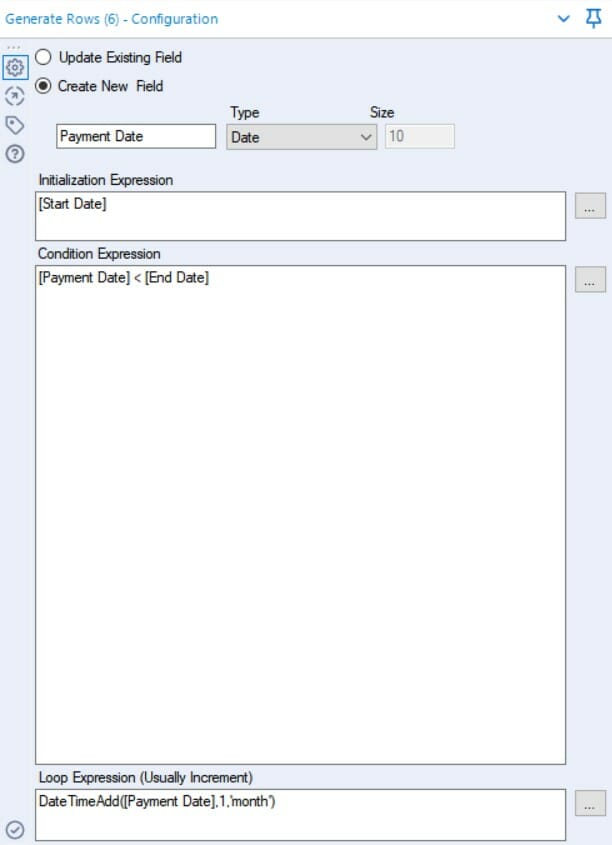
Next, you use the Generate Rows tool to duplicate the clients’ information and make a new row for each month they will be paying money in during the length of their contracts. Call this field the Payment Date.

What this configuration means is that you are creating a new date type field called Payment Date that will generate rows with consecutive months added one by one (Loop Expression), starting at the Start Date (Initialization Expression) and up to the End Date (Condition Expression).
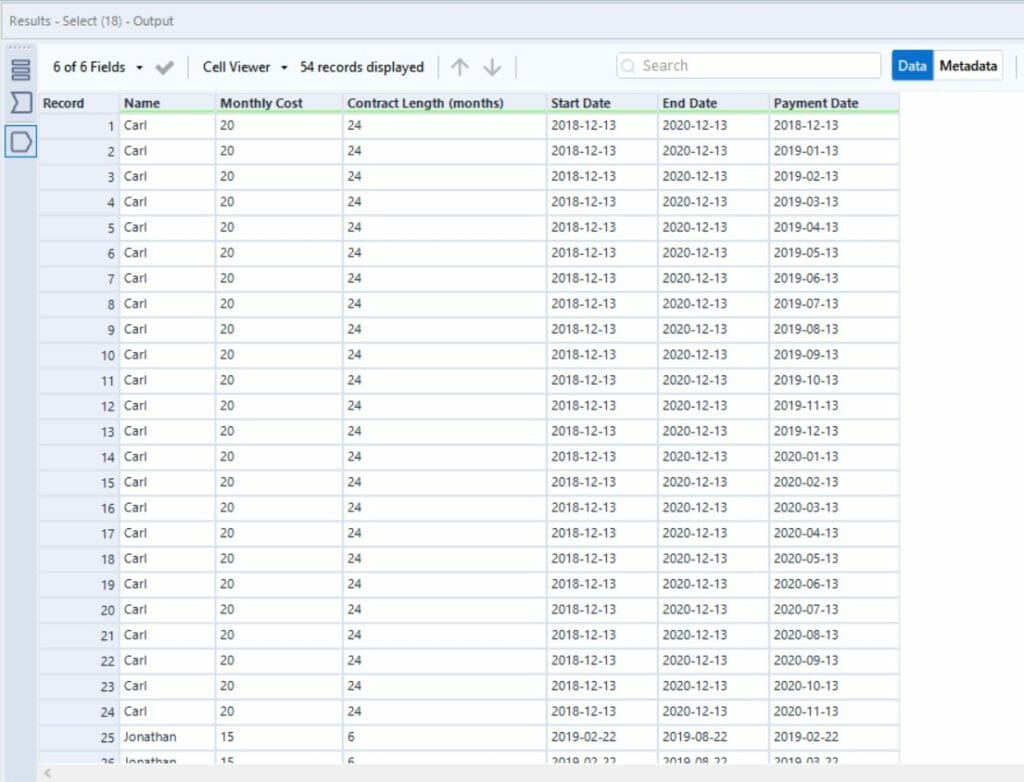
Outcome:

Here you can see that you get 24 number of records for Carl, which is the number of payments he is expected to pay in according to his contract length. If all the number of rows for each client is matching the number of months in their contract length, you did it right.
Your data scaffolding is ready. Now all you need to do it to clean up unnecessary fields and sort it out to your preferred view. I sorted mine by ascending Payment Date and here is my outcome:

Now that you’ve just learned another way to do Data Scaffolding (or maybe your first way!) using Alteryx, share with us what your favourite method is!
