


Today we were tasked with reproducing some charts created using LODs in PowerBI. I chose a highlight table representing how long it took between a customer's first and second order.
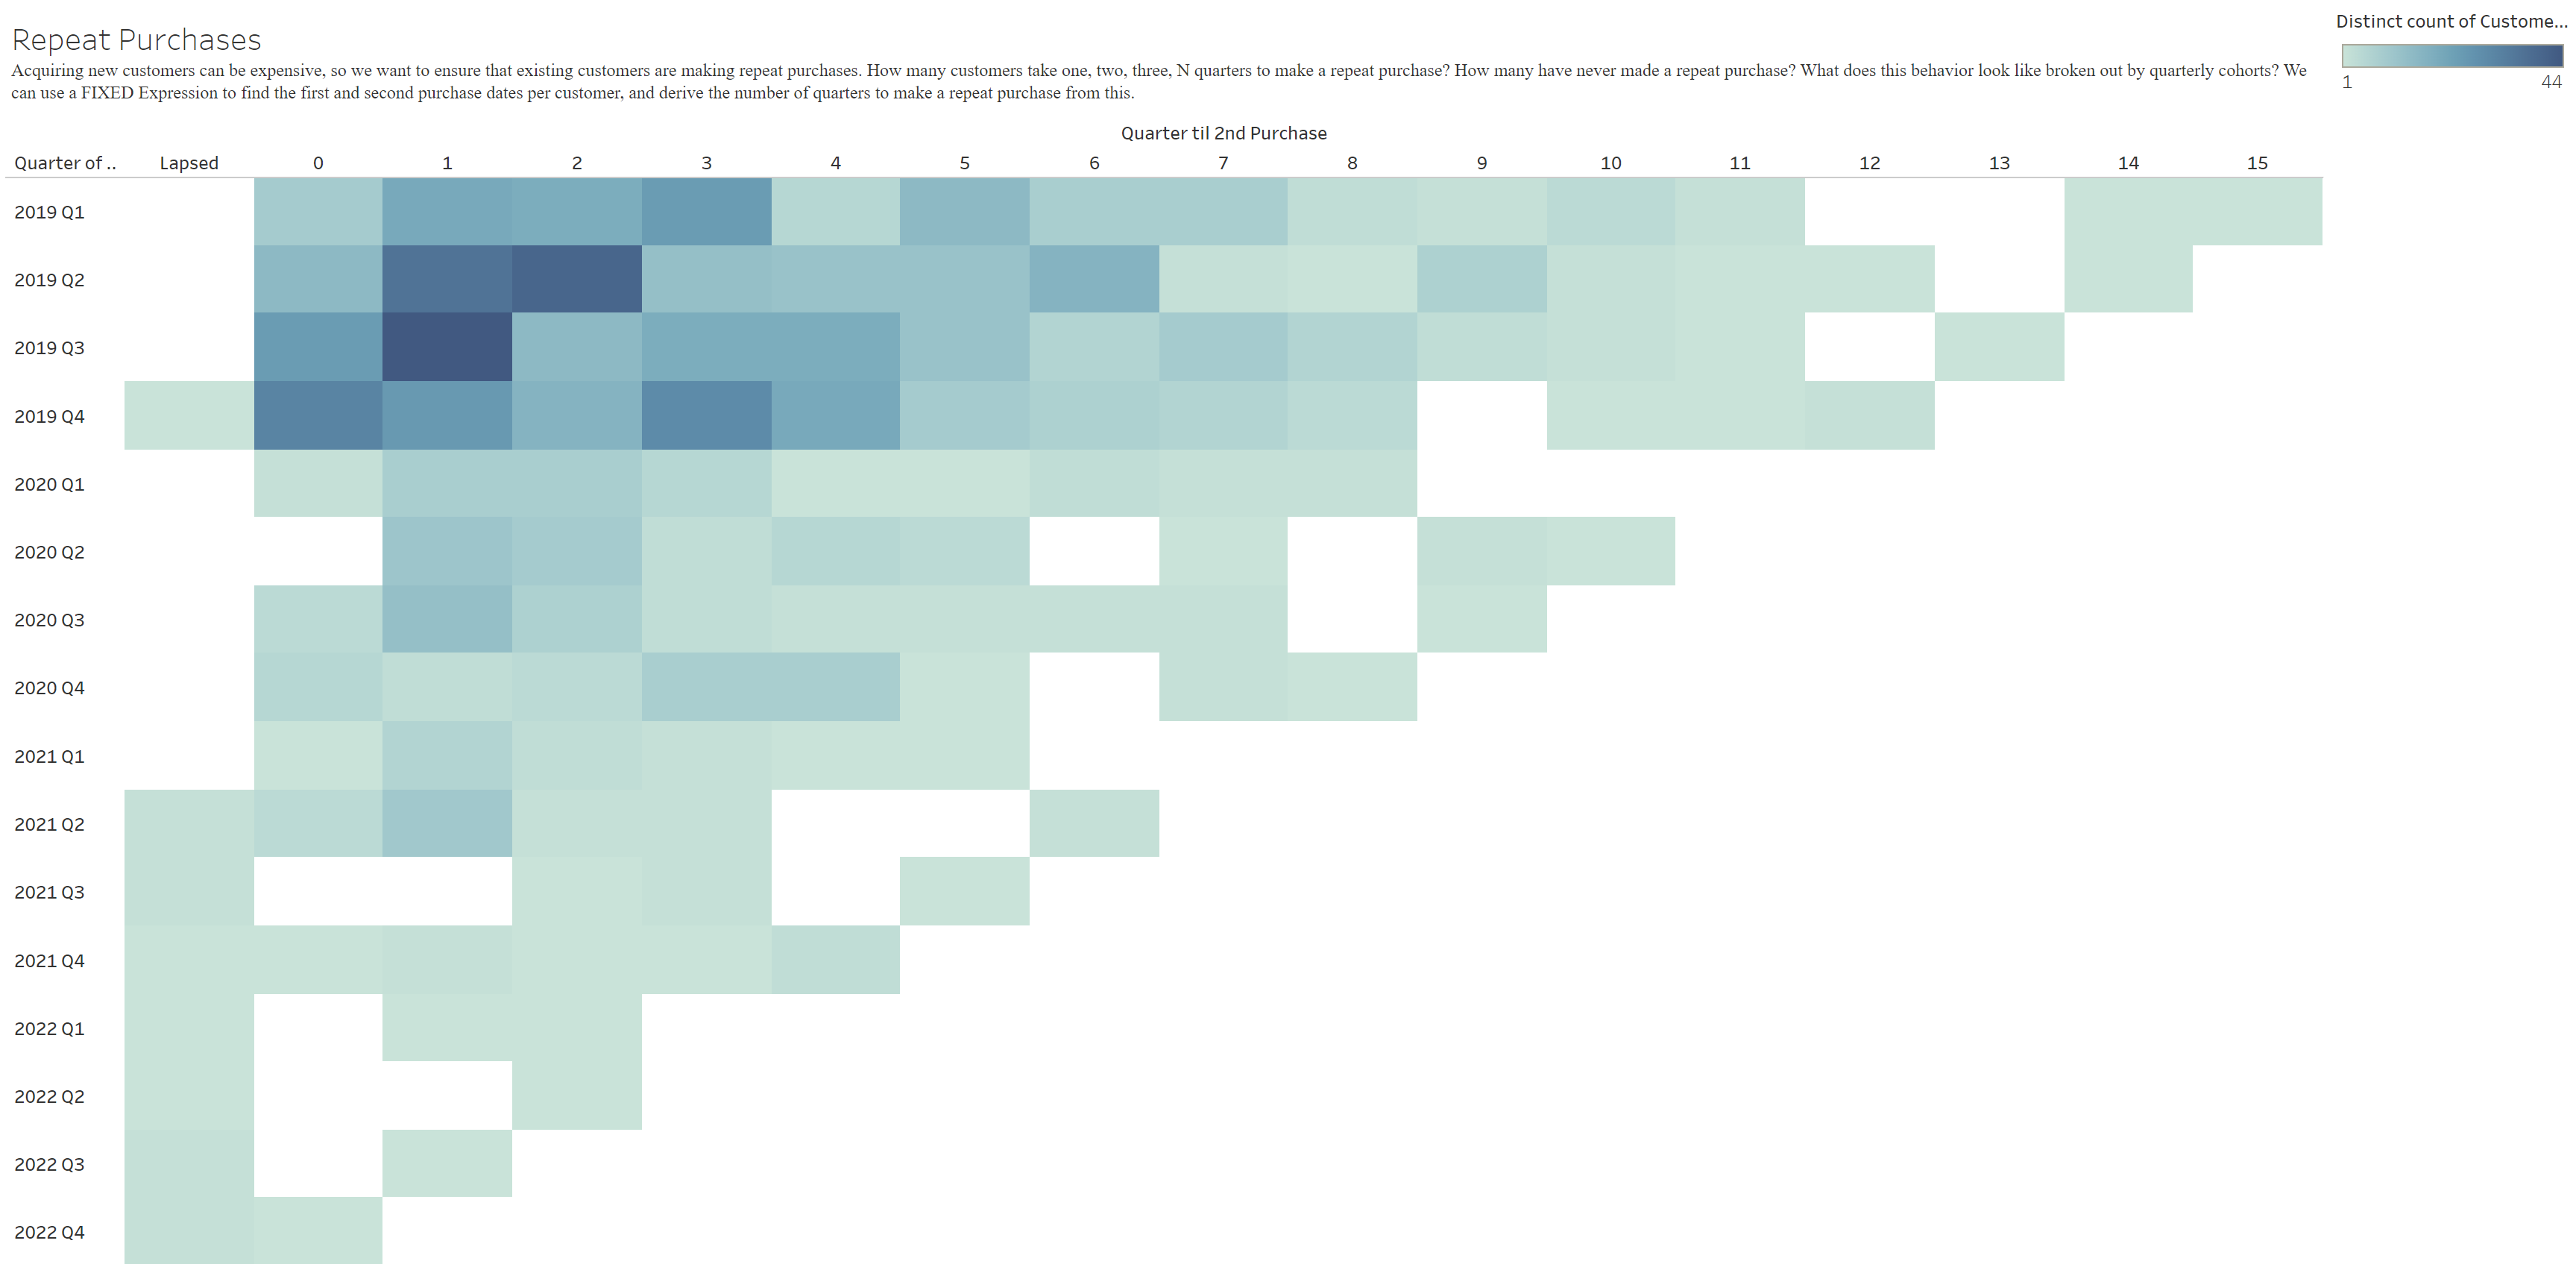
Let's start with the logic behind how this works. First the Quarter till 2nd date measure is the number of quarters different between the first and second order. We therefore need for this to have a field with the date of the first order of a customers as well as a second field with the date of the second order of the same client. The y axis is based on the quarter when the first order was made and the colour gradient is based on the count of customers in each cell.
To create the first order date field, I used the min() function in DAX to create a column. I used the ALLEXCEPT function then to make sure that it would calculate this per customer. This is what it looks like:
First Order = CALCULATE ( MIN ( Orders[Order Date] ), ALLEXCEPT(Orders, Orders[Customer Name]))
Then I need to get my second order date. For this I first created a column which would contain the date of any order that isn't the first one of a customer. I therefore used an if statement, which only keeps dates which are after the first order date for each customer. Be careful, you need to use BLANK() instead of NULL or 0 or '"" as it is the only one that works with dates.
Repeat Purchase = IF(Orders[Order Date]>Orders[First Order], Orders[Order Date], BLANK())
Now is time to get that second order date. I used the same function as in the first order date column, but on the repeat purchase column.
Second Order = CALCULATE ( MIN ( Orders[Repeat Purchase] ), ALLEXCEPT(Orders,Orders[Customer Name]))
Finally, time to get our difference between two dates. DAX has a function for this purpose, just like tableau does.
DateDiff = DATEDIFF(Orders[First Order], Orders[Second Order], quarter)
Finally, sadly PowerBI created subtotals based on the date hierarchy when creating a matrix. Therefore I needed a new y axis. I therefore searched the web for a good way to obtain only Quarter + Year. This is what some PowerBI connoisseurs provided me with:
Quarter = YEAR(Orders[First Order]) & " " & "Q" & CEILING(MONTH(Orders[First Order])/3,1)
Here is the final result
In the report you will find 2 other visualisations I had time to build. Feel free to reach out to me in case you want to know more about them!