In this blog I am going to try and explain the calculations that are used when building a Trellis Chart in Tableau. These type of graphs are a good way to display an overview of the data by having multiple charts on one worksheet.
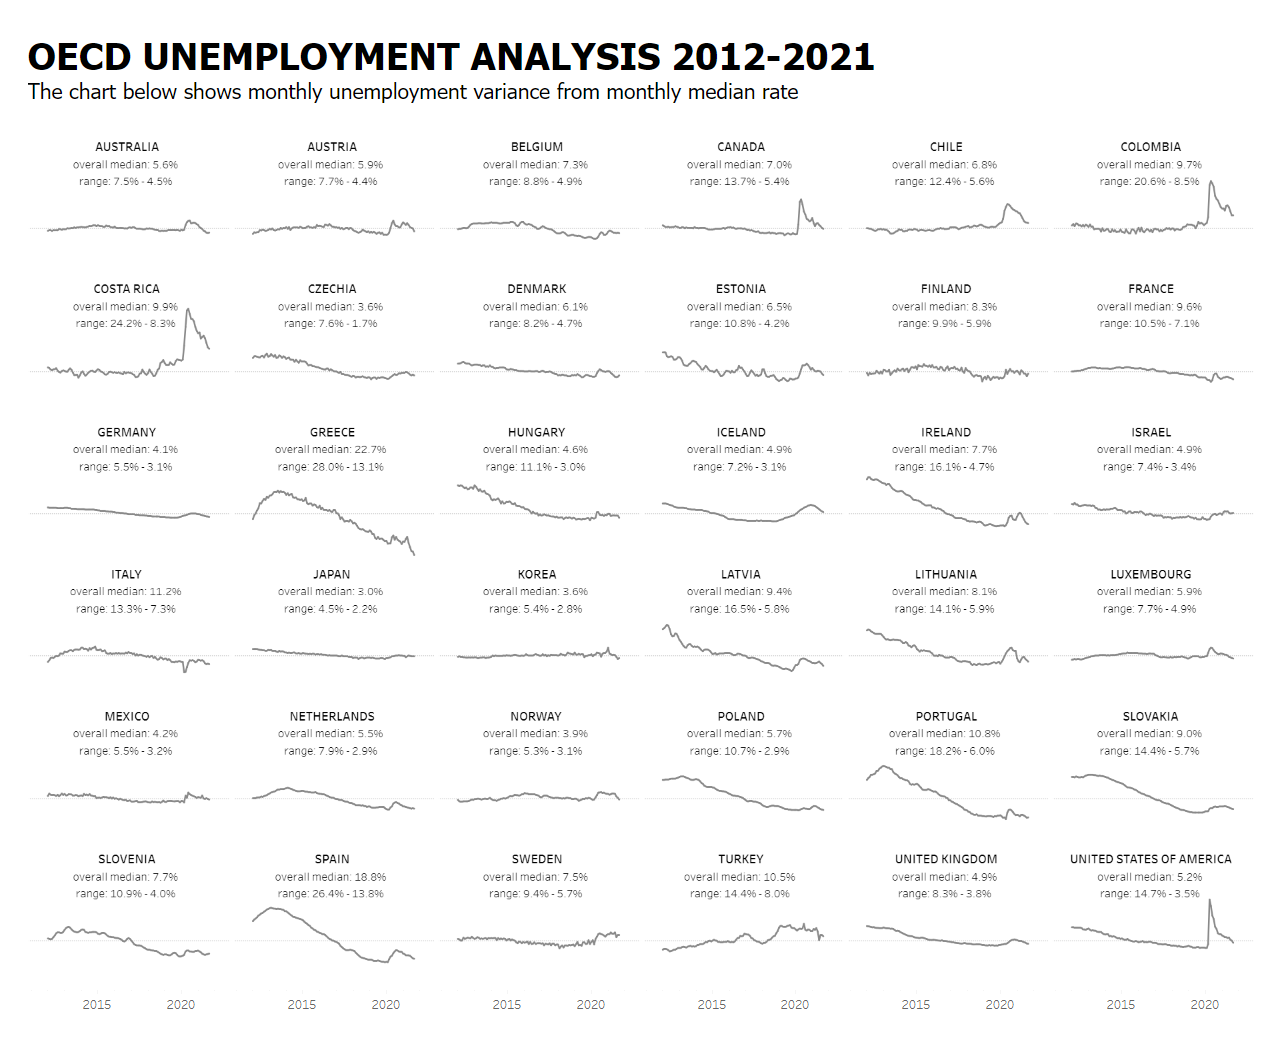
To make this chart you need 3 key calculations for the rows, columns and labels. The rows and columns calculations make sure that your charts stack correctly and the labels calculation is used to centre the labels above each of the charts. It does help if there are an even number of charts that you are intending on displaying so the grid looks neater and complete. The reason the countries are sorted alphabetically, in the chart above, is because that is the order in which they were inputted.
Columns

This calculation will make our graphs vertically stack correctly. In the table below you can sort of see what this calculation does.
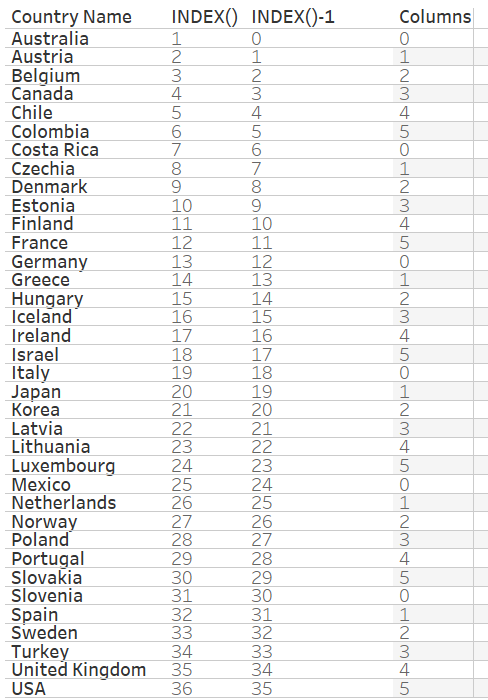
Index () | Creates a row number for each of our different countries
Size () | This calculation counts the number of points you have (there are 36 countries so Size() = 36) This means SQRT (Size()) = 6
Int() | Just makes the value, so 6, a whole number/integer
% | Modulo - this gives use the remainder after a division
So for example:
Costa Rica -
Index () = 7
Index () - 1 = 6
Int(SQRT(Size())) = 6
6/6 = 1 there are 0 remainders so the output of this calculation would be 0
That same logic follows for when Index () = 13 (Germany)
12/6 = 2 there are 0 remainders so as you can see on the graph above Costa Rica and Germany are vertically stacked on top of each other.
The reason we have to use Index () - 1 and not just Index () is so Australia is stacked correctly. If we had just used Index () then:
Index () = 1
1/6 = 0.167.... remainder 1
So the output of the calculation for Australia would be 1 which means the countries would not stack in the correct order.
Rows

A very similar logic is applied to align our graphs correctly.
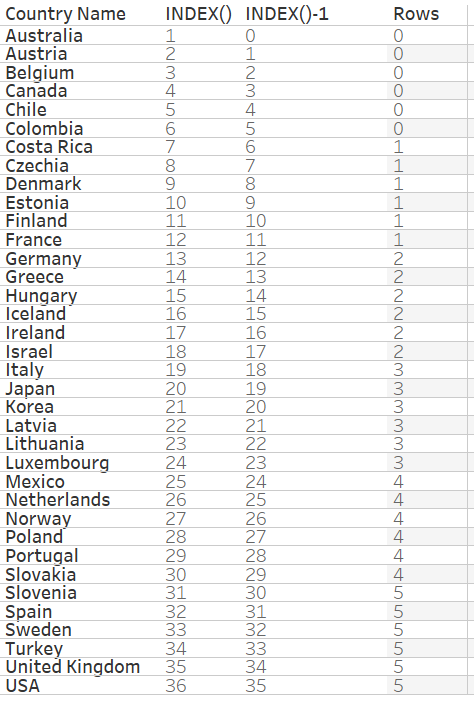
So for example:
Costa Rica -
Index () = 7
Index () - 1 = 6
Int(SQRT(Size())) = 6
6/6 = 1
By wrapping the entire calculation with Int() we are converting any decimal values to whole numbers. The Int () function in Tableau automatically rounds down.
When Index () = 11 (Finland)
10/6 = 1.666... which rounds down to 1
Hence Costa Rica and Finland are in the same row in our graph above.
The reason we have to use Index () - 1 is so we can have 6 charts per row.
For example:
Colombia -
Index () = 6
6/6 = 1
The chart for Colombia would be in the 1st row if we had used Index (), meaning there would only be 5 charts in the 0th row.
Labels
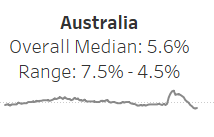
We want our labels to be at the top centre of each of our charts.
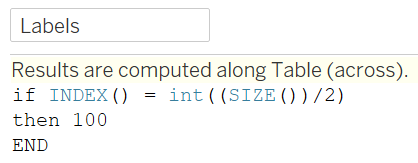
Looking at our graph for Australia, we want to count the number of points along the X axis, then half that to find the centre of our charts. Our date field is on our X axis so we want the Index () function to number each of the points along the X axis and our Size() function to count the number of points.
Size () = 117
Size()/2 = 58.5
Int((Size())/2) = 58 because the Int () function rounds down
We can see below that when Index () = 58 our conditional statement is TRUE.
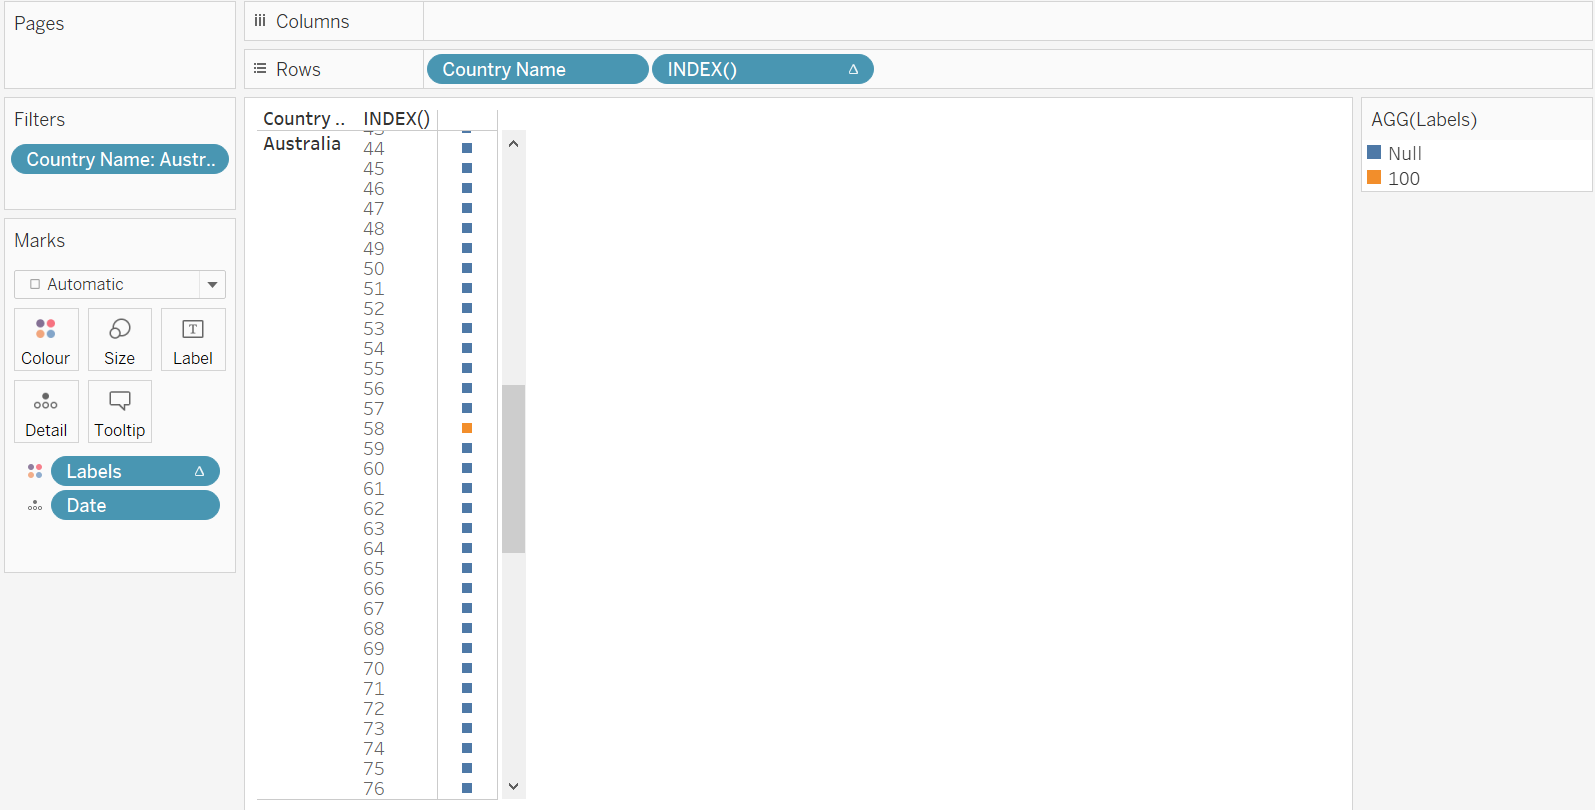
So every time the Index () = 58 our statement will be TRUE meaning we will get a label for each of our charts.
The value of 100 here is completely arbitrary. It should typically be the maximum value of the metric you are using, or just above, so your labels don't overlap any points in your charts and have enough space.
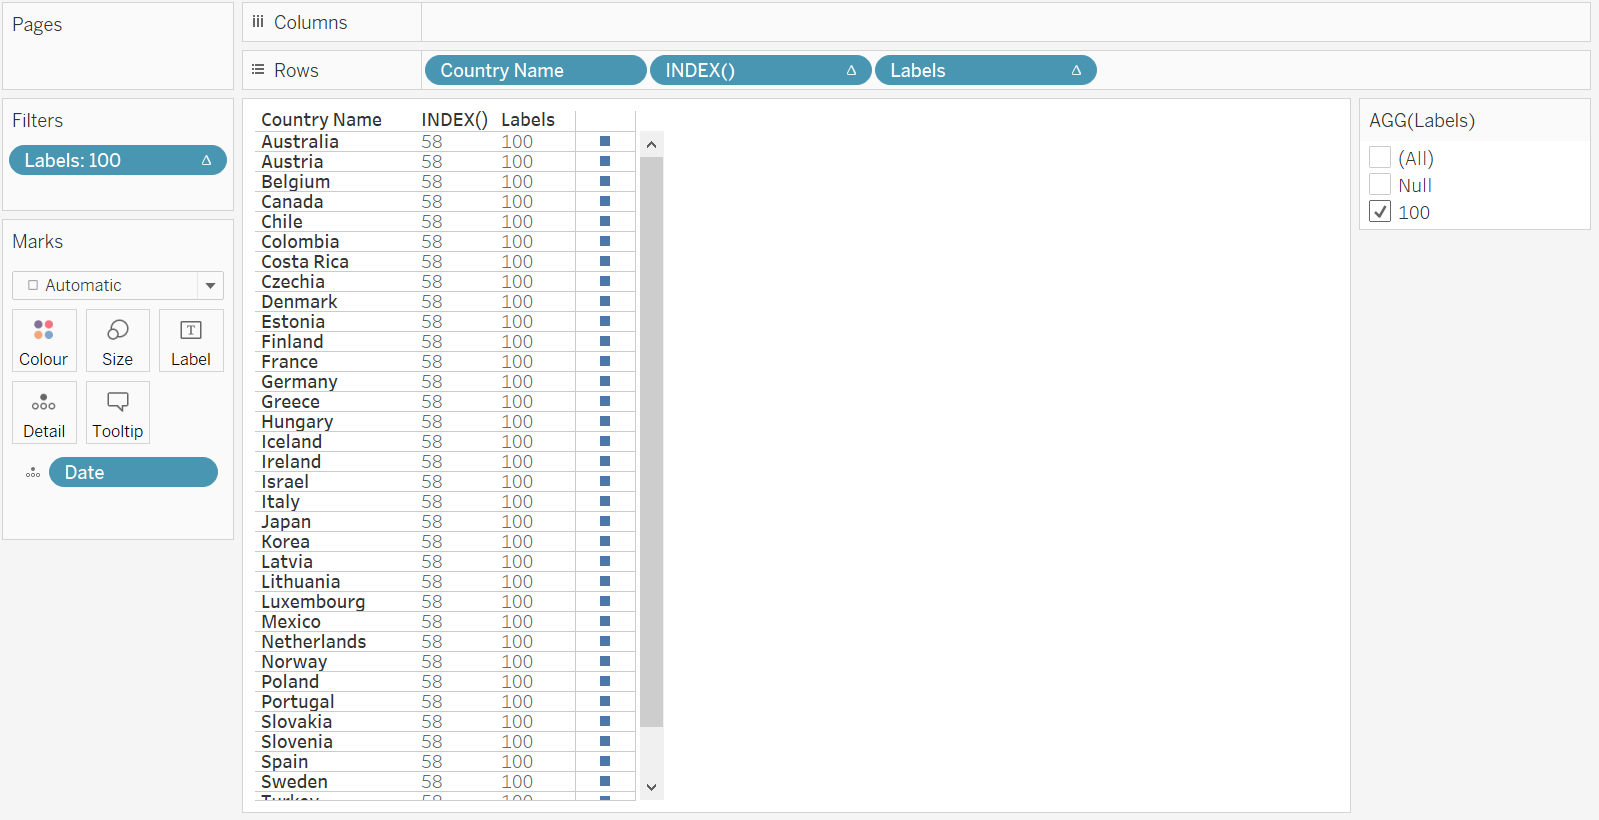
Lastly to create the Trellis Chart you would just dual axis the label field with your metric, but you do not need to synchronise the axes as this will squash your chart. Make sure the table calculations are computed correctly!

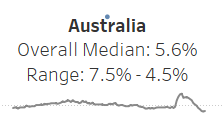
I made the transparency of my label marks card 0% so I just see the text and not a point.
Otherwise you would see the below:
The Trellis Chart used in this blog was made by following this Workout-Wednesday by Sean Miller.
