Most people have probably used table calculations, especially quick table calculations. Quick table calculations can be intuitive to use, but understanding how they truly operate is useful for unlocking their full potential and ensuring your numbers are correct!
Table Calculation context
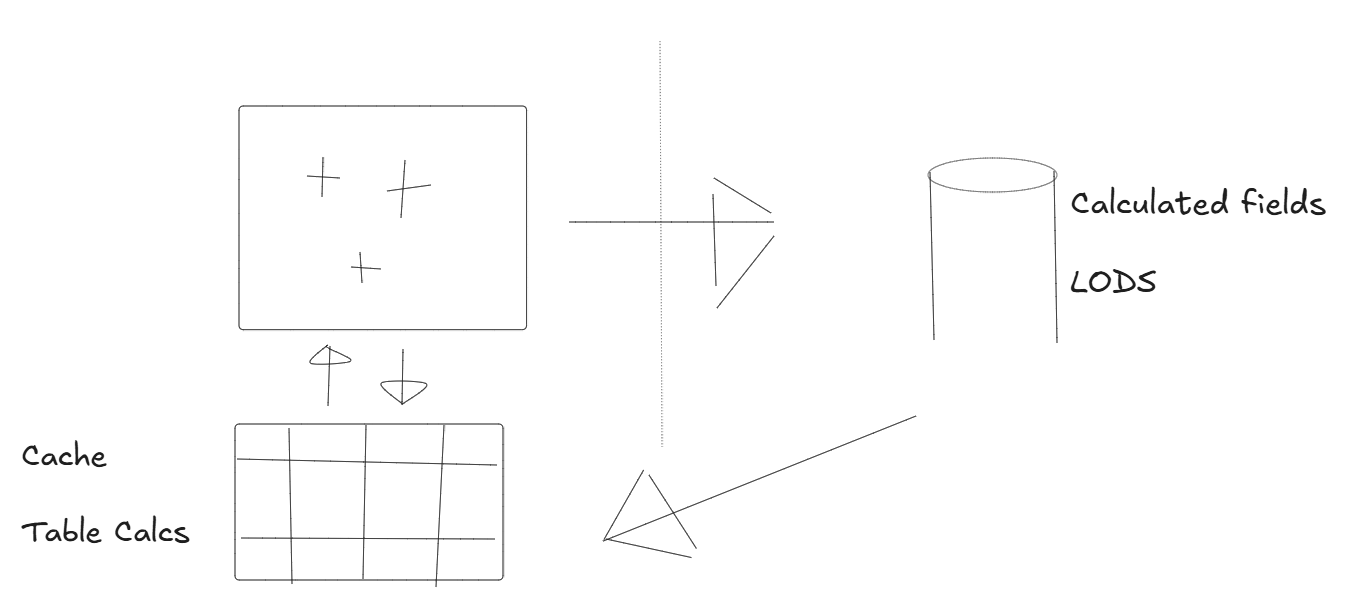
- Table calculations are computed by Tableau after query results have been returned from the data source. In Tableau Desktop, these calculations are processed on the local machine. Therefore, when assessing performance, the power of your laptop can impact the performance of a table calculation.
- When you bring discrete (blue) fields into Columns and Rows, this defines the level of detail for the particular view. Table calculations operate at the level of aggregation present in the view.
How to navigate the add table calculation pane
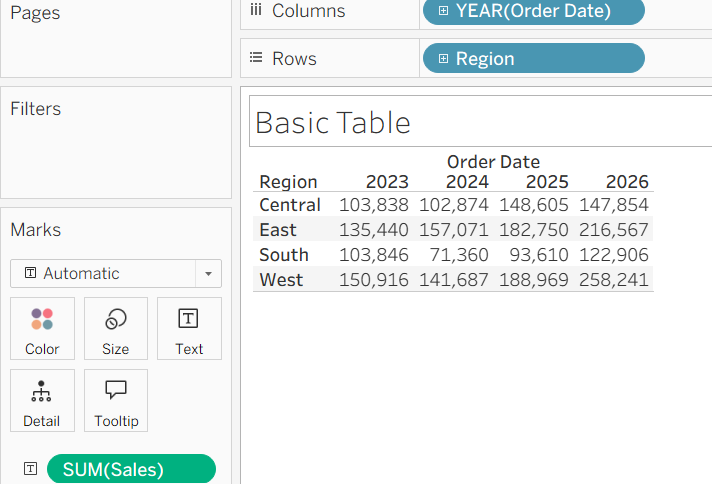
Using the above basic table, if we focus on the question:
What is the percentage contribution of each region to total sales for a year?
When you right-click of SUM(Sales) and navigate to add table calculation, you then open the pane shown below. A useful phrase to remember here is:
For each [unticked] do a [table calculation] across [ticked]
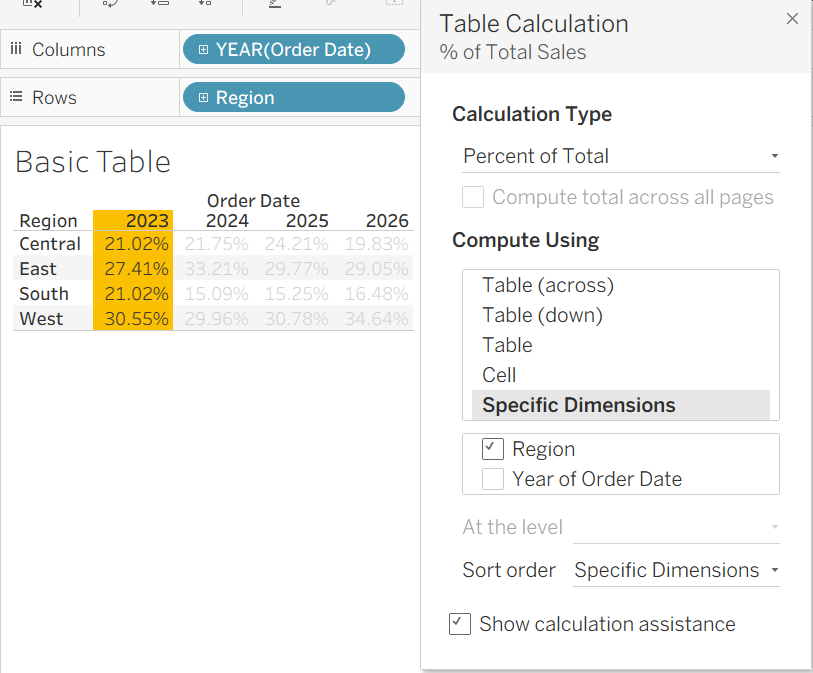
For the image above: For each [year of order date] do a [percent of total] across [Region]
An example using a combination of table calculations (Stock price moving average)
This example looks at NVIDIA stock price data from google finance where table calculations have been used to better visualise stock price over time. The tableau worksheet shows the percentage difference in stock price from the first mark in the view (grey line) and then extends that concept using a 30-day moving average (orange line). This can be a more effective way of analysing investment performance than viewing stock price alone, as you can compare returns on a consistent percentage basis regardless of the stock's absolute value.
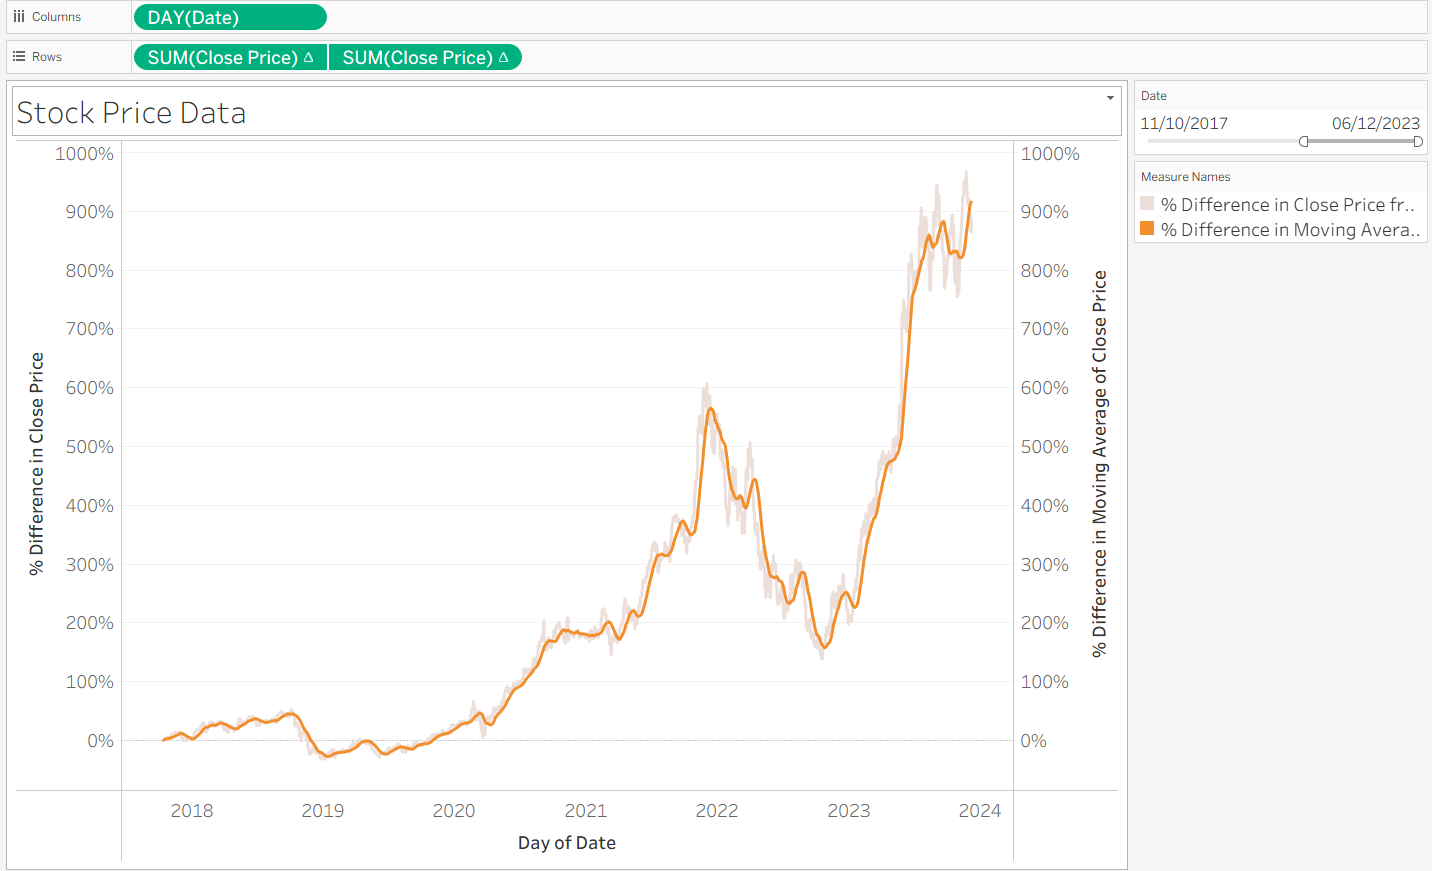
To create the grey line:
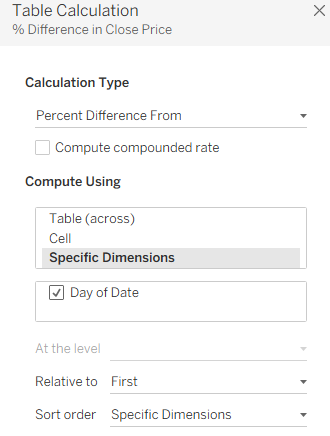
An important takeaway is that relative to first refers to the percentage difference compared to the first point in your current view, rather than the first date in the dataset. This is useful because filtering the view allows you to select different starting points for your analysis.
To create the orange line:
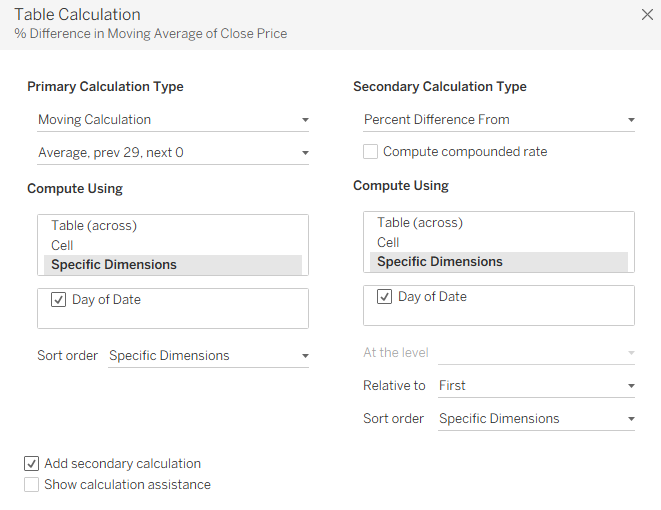
The moving average calculation computes the average stock price across the previous 30 days and then combines this with the percentage difference from the first date in the current view (the same calculation used for the grey line). This combination of table calculations is useful because buying or selling stocks may not occur on a specific day due to things like market opening times, so the moving average helps smooth out short-term fluctuations and highlight the underlying trend.
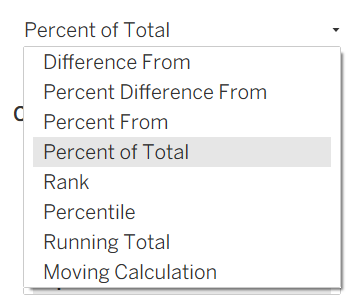
Types of table calculations available
There is a wide range of table calculations available. Running Total and Moving Calculations are two examples that also allow you to apply a secondary table calculation on top of them.