


Our final brief of dashboard week is to create the start of an entry for the NFL Big Data Bowl hackathon, which focuses on the player movement before and after a pass.
As with previous weeks my first step is to breakdown the time available to me and plan out the next two days.
Time budget
Thursday
0900 - 1100 - Understand the brief, scoping and research
1100 - 1200 - Extensively plan, understand required calculations and sense check scope
1200 - 1300 - Lunch
1300 - 1400 - Sketching
1400 - 1500 - Data transformations (hopefully minimal with this project)
1500 - 1700 - Building charts
Friday
0900 - 1200 - Building charts
1200 - 1230 - Lunch
1230 - 1430 - Dashboard formatting
1430 - 1530 - Presentation prep
Plan
After reviewing the data, I decided to focus on pass receptions. This involves tracking the runs of receivers and observing successful/unsuccessful outcomes. Luckily, we can see the route that target receivers run. This means we can bin/colour different routes!
I think the big picture will be understanding which routes run by receivers lead to the most successful outcomes and with the following user stories in mind, allowing coaches to understand what routes suit which players.
User story
As a ... NFL Coach
I need ... to understand the most successful routes run by receivers/my own players
So that ... I can utilise the best tactics to win games
This can achieved by ... visualising routes run by different players, showing success rates overall and by player. Possibly breaking this down into different types of pass i.e long/medium/short
Required columns from data
Essential:
input file
- play_id (not unique across games)
- game_id (primary key)
- nfl_id
- play_direction
- player_name
- player_position
- player_role
- num_frames_output
- ball_land_x
- ball_land_y
- play_direction
output file (all files)
- x co-ordinate
- y co-ordinate
- play_id (not unique across games)
- game_id (primary key)
- nfl_id
- frame_id (starts at 1, increments with each frame of a play.)
supplementary file
- route_of_targeted_receiver
- season
- week
- home_team_abbr
- visitor_team_abbr
- game_id
- play_id
- pass_result
- pass_length
- offense_formation
- team_coverage_man_zone
- play_description
- team_coverage_type - The specific kind of coverage assigned on the play (text)
- team_coverage_man_zone: Indicates the overarching type of coverage (Man/Zone) on a play (text)
Inspiration
https://public.tableau.com/app/profile/tim.lafferty/viz/NFLReceiverRoutes/ReceiverRoutes
Data prep plan
As it's a very large dataset, start by pulling in a single week of inputs and outputs and then the rest can be unioned in after testing with the nimble dataset.
We will need:
Unified frames table - gives a path ID of the players movement, contains the x and y, frame ids (modified to differentiate between input and output), and keys to allow relationship with the play info table
Play info - this is an aggregation of the input/output file that takes the information about the play and aggregates to that play (removing all but the first frame and dropping the frame column)
Supplementary
This table (hopefully) won't require much data prep.
Sketching
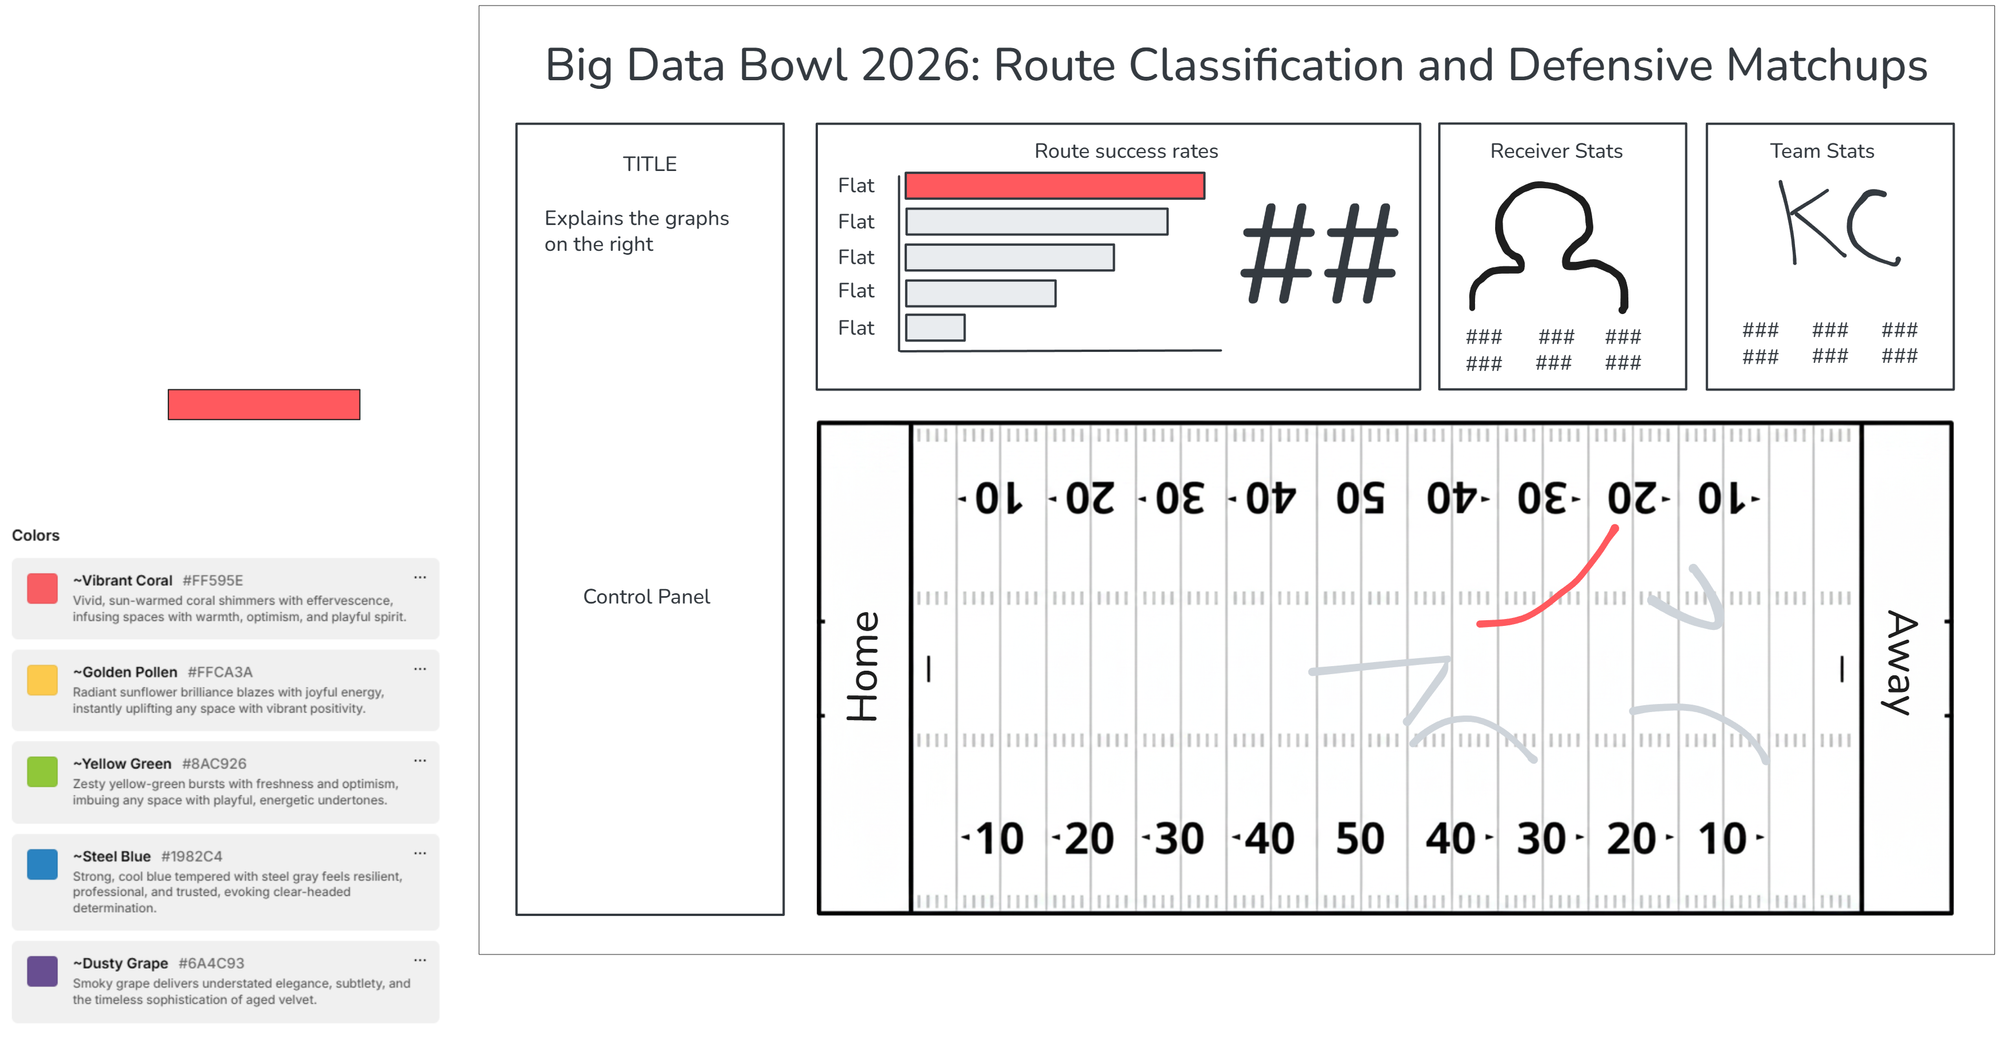
Building time!
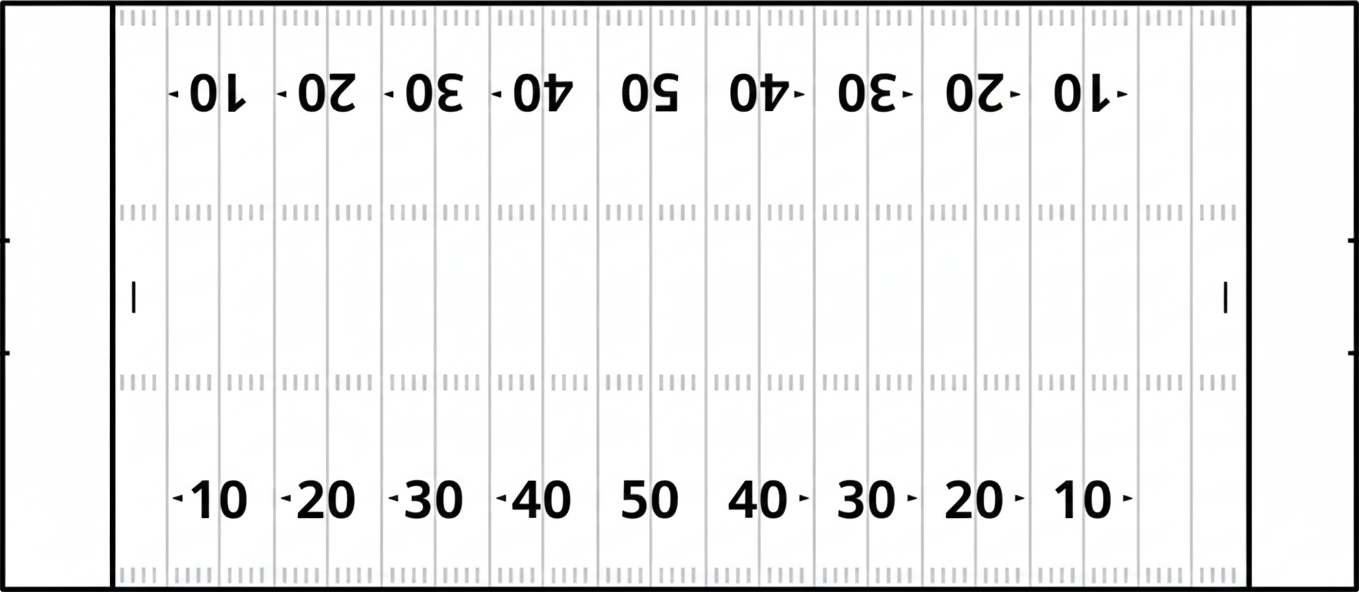
I decided to utilise a background image for visualising the pitch, as this would help the view see the context of where the runs started/ended.
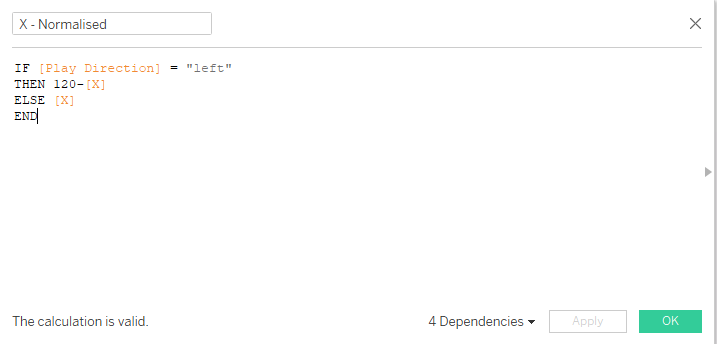
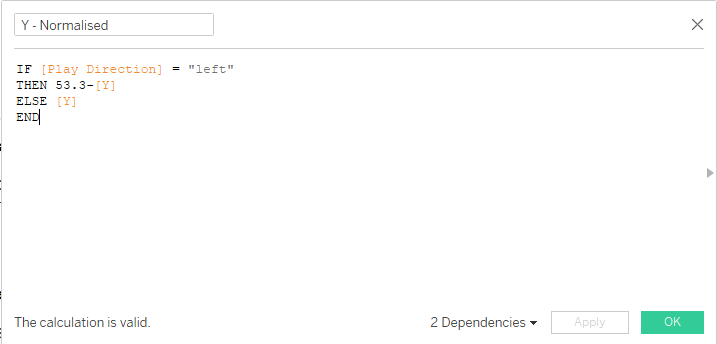
After receiving some feedback, I realised that I also needed to normalise the data so that any runs that were being performed from left to right would be inversed, so that you could see all the runs in the correct direction.
That calculation ended up like this:
I ended up with this!