


The third day of our Dashboard week and our task today was to look at Kickstarter data and generate a KPI dashboard and a more analytical one, both of them with its own mobile version.
Less challenging than previous days but it was not easy due to time pressure!
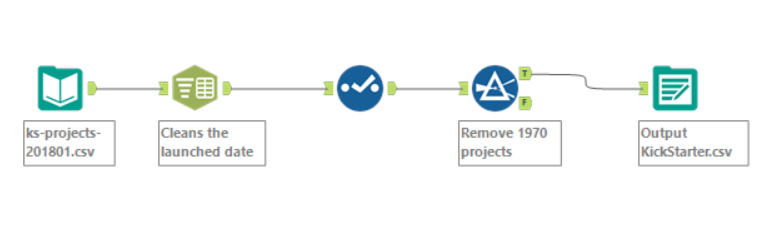
I did some data prep where I clean the date the project was launched and also remove some projects that started in 1970…
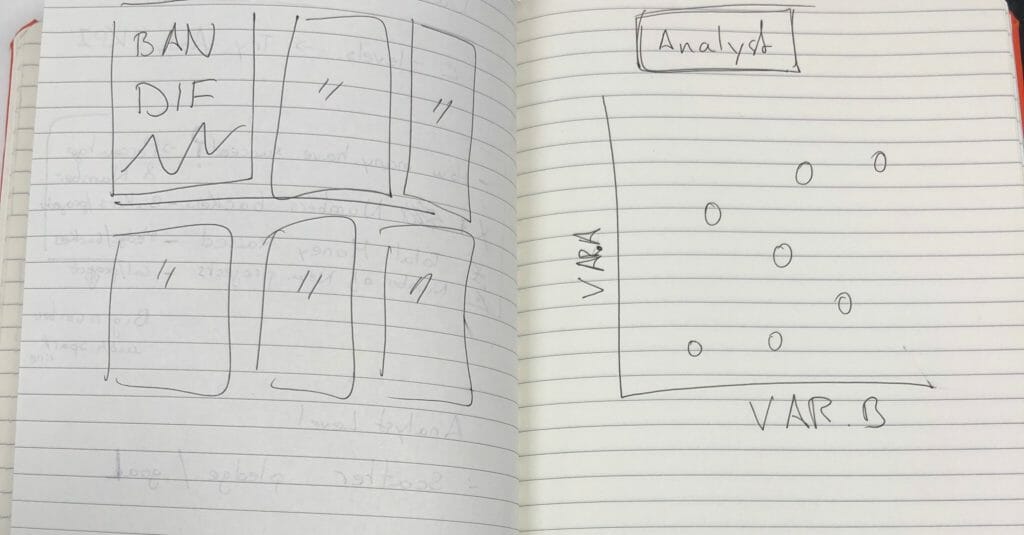
This is the sketch I thought of doing which I followed pretty well.
As for my C-Level dashboard, I wanted to show some big numbers for some KPIs that might be interested and also comparing them to the previous year. The comparison was a bit challenging due to the amount of LODs calculation I had to do. Lastly, I show a monthly timeline with the current year selected highlighted. Have a look at it clicking in here.
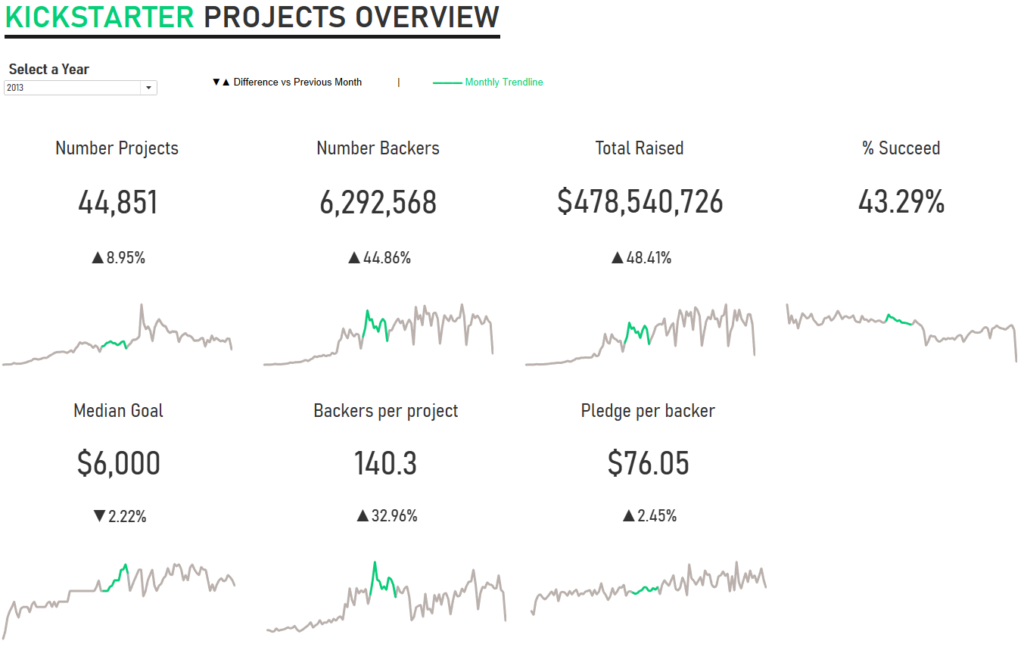
Here you can see the mobile version.
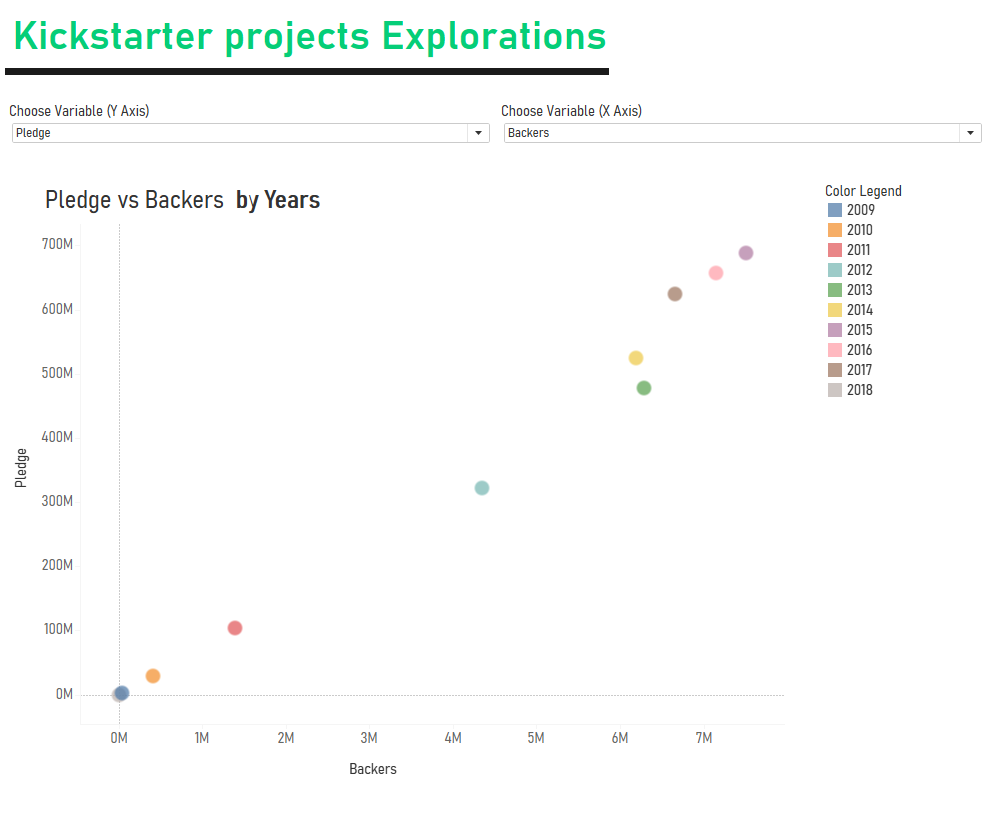
As for the analytical dashboard I have created a dashboard very interactive, where you can select the metrics you want to compare in a scatter plot and also used set actions to drill down into different levels within the dataset. You can see it here.
This is all for today! Looking forward to tomorrow’s challenge.
Jose Valero