


Title and Subtitles are fundamental concepts in any visualization. It’s the first thing that grabs your attention and sets the tone for your viz. It can also provide context, which helps the reader better understand. Keeping it simple is essential as well.
There are many different types of titles or Subtitles we can utilize, but in this blog, we will focus on: Questions, Definite statements, Descriptive titles, and Quirky Titles.
Question Title
When choosing a title, you have to be careful and choose which one you want to utilize. For example, you can have a Question as the title of a graph, the title of a section, or the Dashboard itself. You then will base your dashboard to answer that Question. We can see that in the example below:

Definite statement
You can utilize a Definite statement as a Title or Subtitle and then follow it with a graph(s) to solidify further the point you are trying to make. We can see an example of a Definite Statement in the following picture:

When writing titles and subtitles, you must make sure the title makes sense and is straight to the point. It's able to indicate what's to come next. Many people sometimes want to add their ideas to the title, which can confuse the reader.
Example of a bad title:
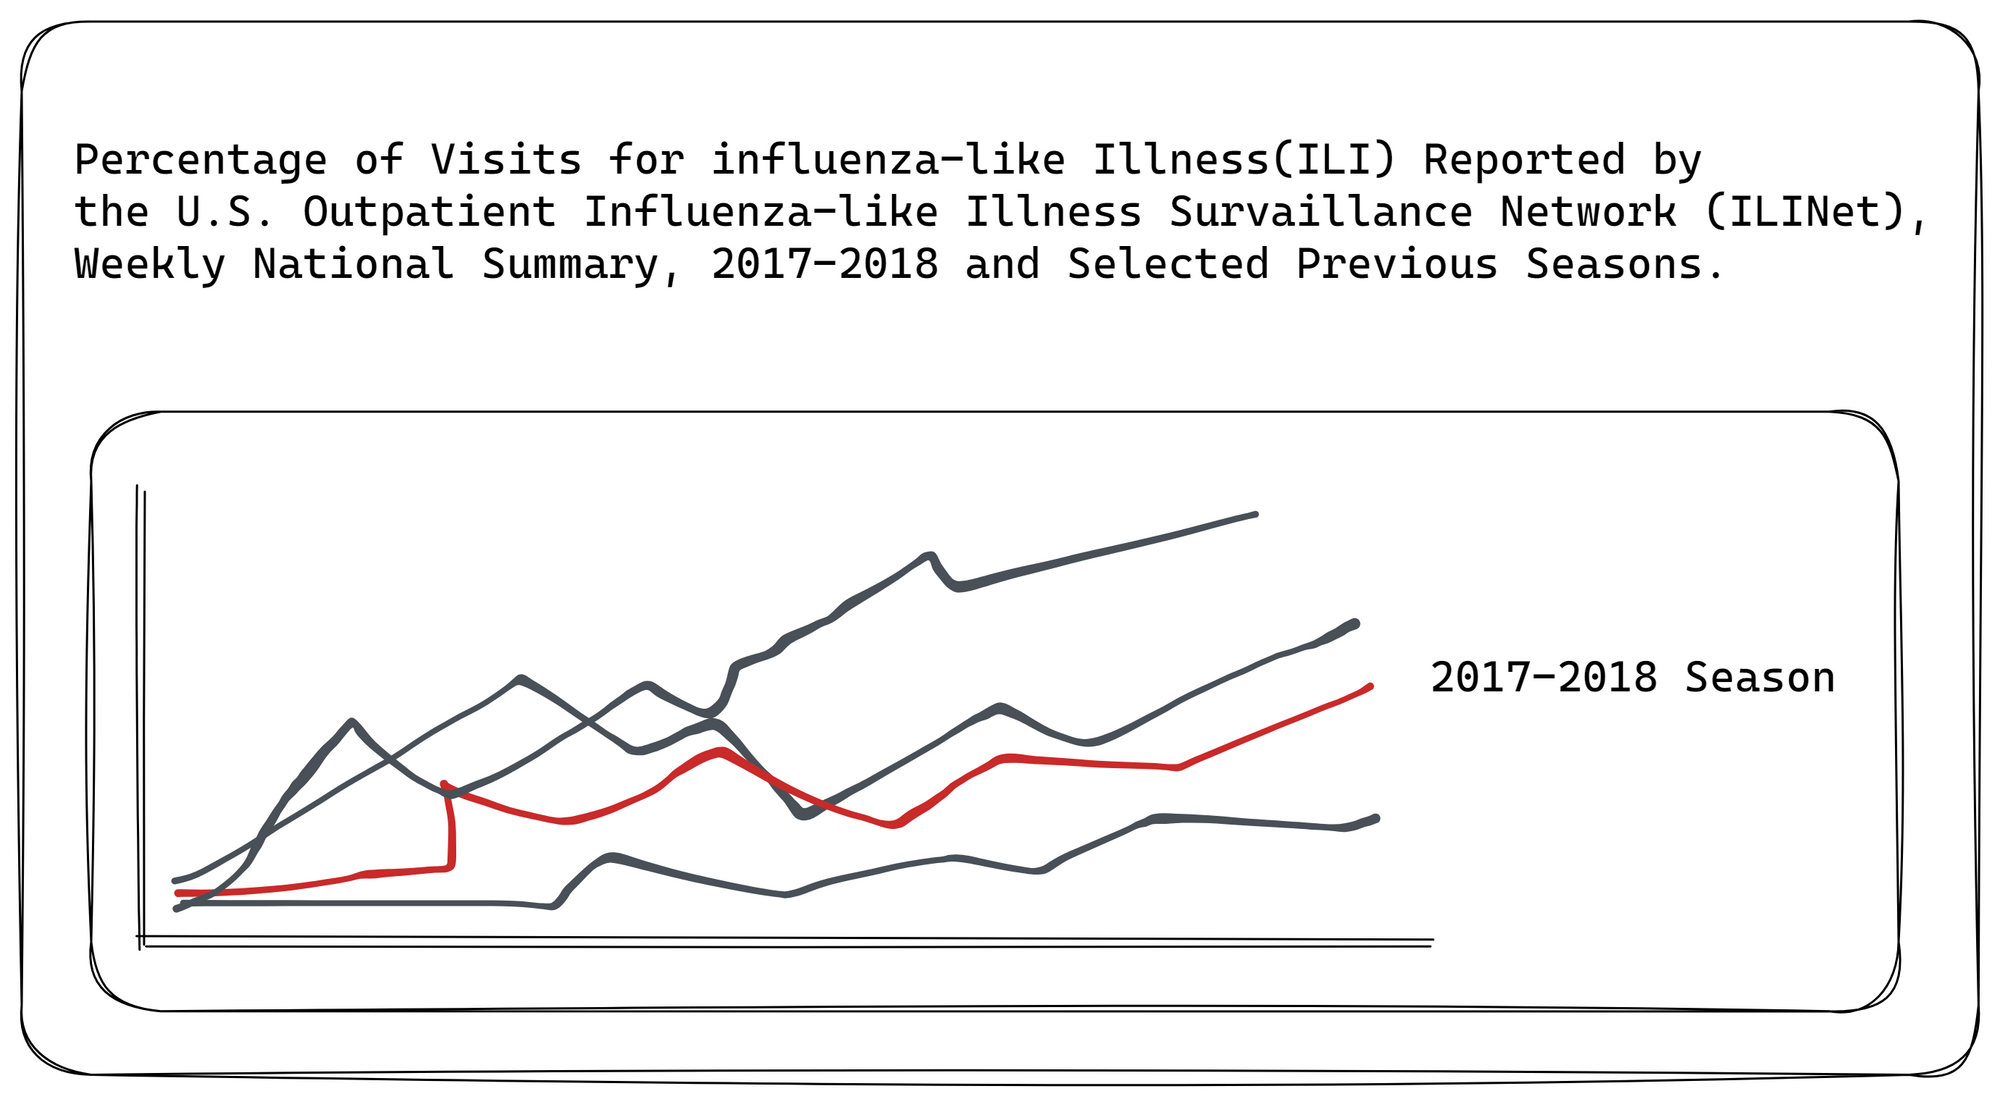
In the example above, we see how the title is too long. It is not very clear what it's trying to convey. This causes the reader to get lost and not know what they are supposed to look at or what the viz is actually about. We can summarize the Title by just calling it. " Percentage of Visits for Influence-like Illness (ILI) over time." We now know that we will be looking at the chart, and we quickly see the percentage increase as we change through the years.
It’s important to note that your titles and subtitles will vary depending on which dashboard or visualization you are making. Sometimes a Question as a title is not the best to use; sometimes, you create a fun interactive dashboard, so you might want to utilize a Quirky title or a Descriptive title to have a better flow in the dashboard.