For Dashboard week day 1, we are working with the National Survey Of College Graduates dataset. For the first part of the day, we received the data at 8:45, and at 9:00 AM, I began data exploration. There are several tables, in different categories, for the most part, time was spent trying to see which angle I was going to take. And trying to have a good understanding of the data.
At the beginning of the day, I picked three tables I would utilize for the dashboard after looking at the different tables. I was planning on cleaning the tables on Alteryx. After I brought the tables into Alteryx, I noticed how different the tables were from each other and the level hierarchy that was present amongst the tables. I spent a good amount of time cleaning one table, and then I noticed I wasn't going to be able to do all three tables I originally planned. Therefore I focused on two only.
After I finished the first table, I worked on the second table; thankfully, it has a similar structure as the previous one in terms of the step taken to clean it. This time around it was faster to clean.
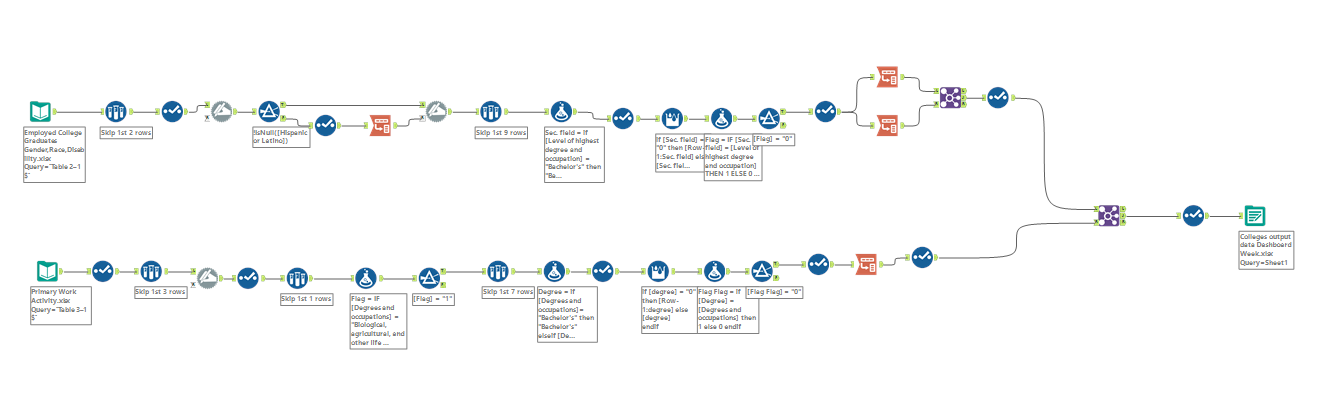
After I fished the Alteryx workflow, I spent a good amount of time testing and making sure the numbers were correct. And the values outputted made sense. When checking the values individually, I obtained the values shown in the original table.
After I had the data, I began sketching what I wanted my dashboard to be, which is shown below.
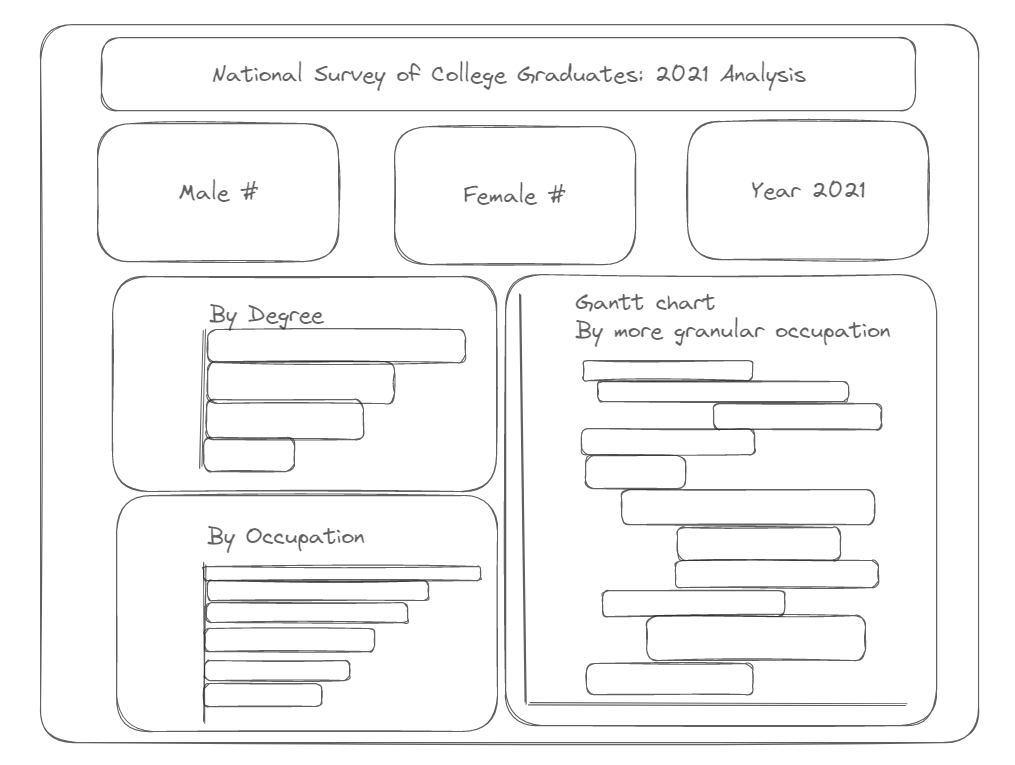
I wanted to compare genders, with the gender provided in the data tables, which were female and male. I would’ve liked to do an overview dashboard and see what insights I could obtain from it.
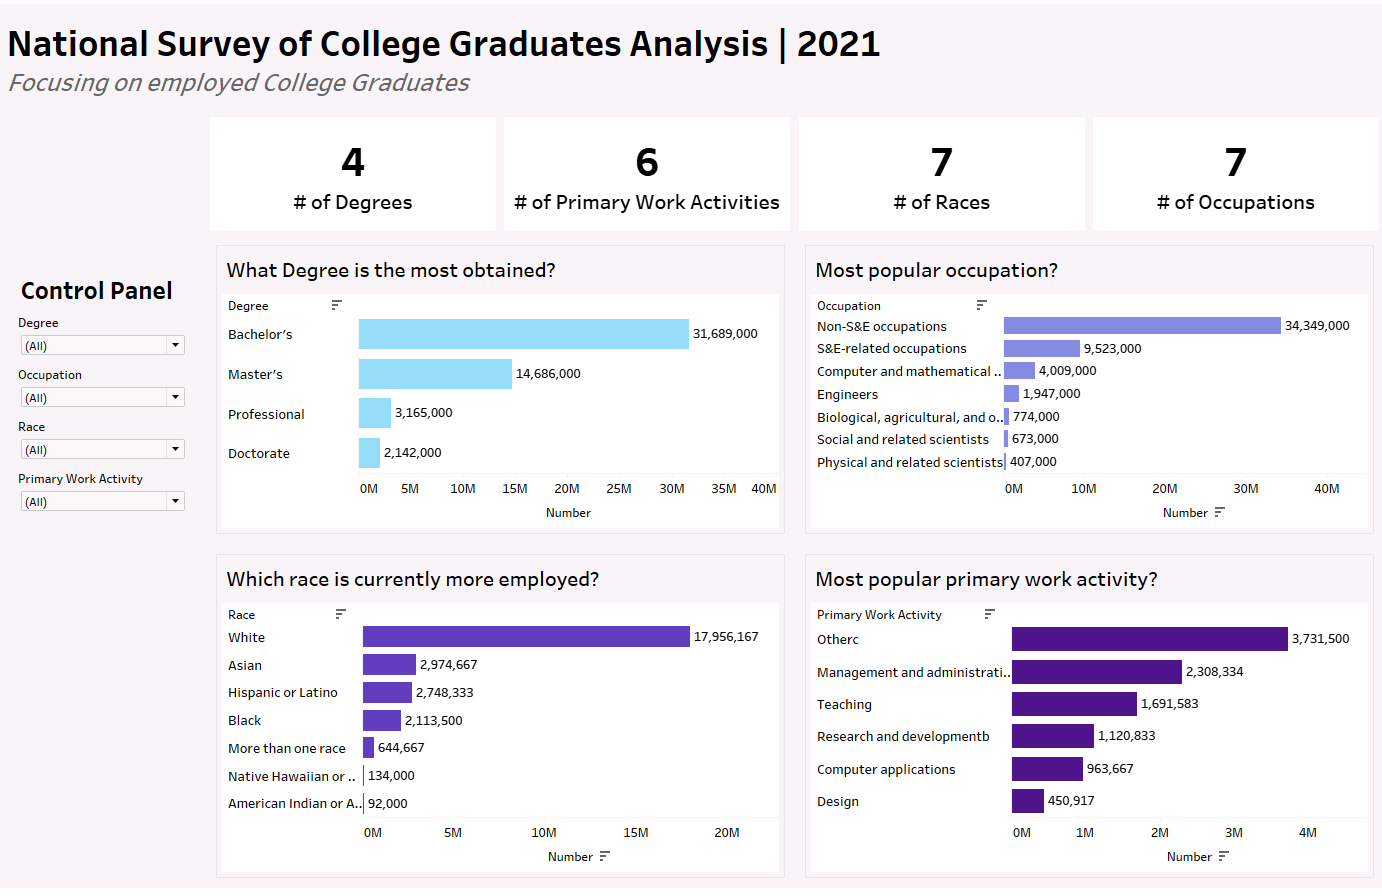
Due to time constraints and some data problems, I couldn't create the dashboard I was planning on doing. I had to make a few changes, and the end result is this: