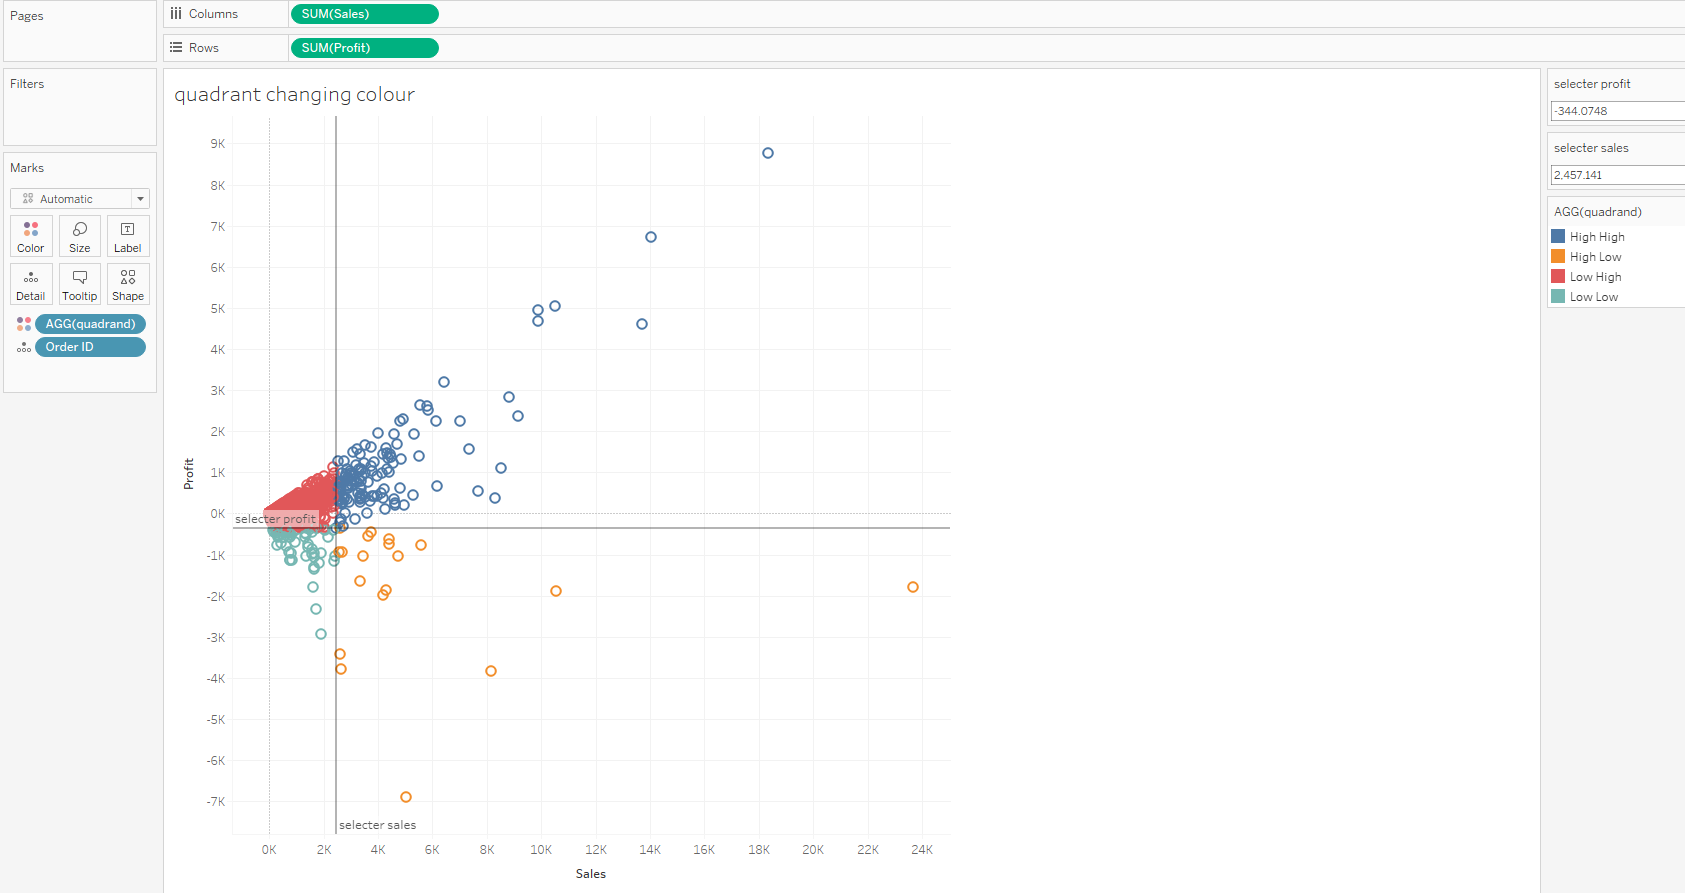
Finished graph:
In this example we will use the Sample - Superstore dataset.
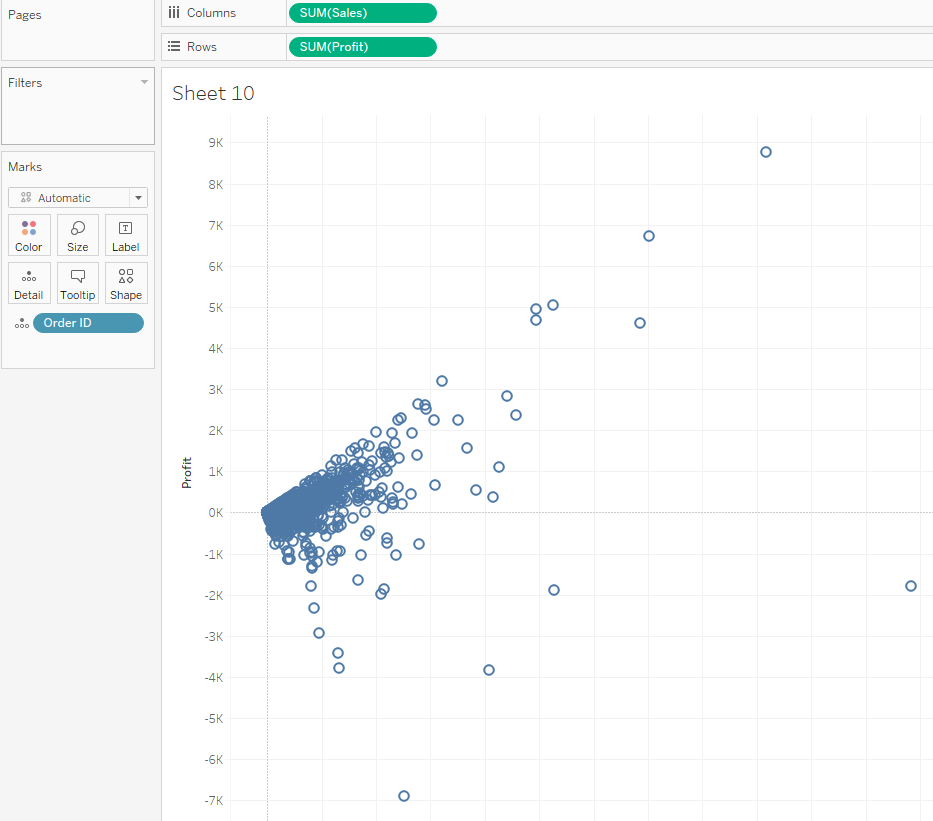
First we need to drag SUM(Sales) onto Columns, SUM(Profit) onto Rows and 'Order ID' onto 'Detail':
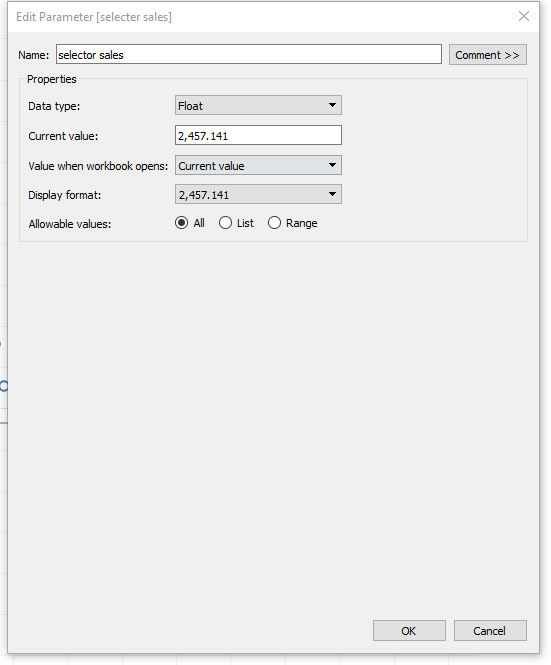
Now we need to create our 'selector sales' Float Parameter:
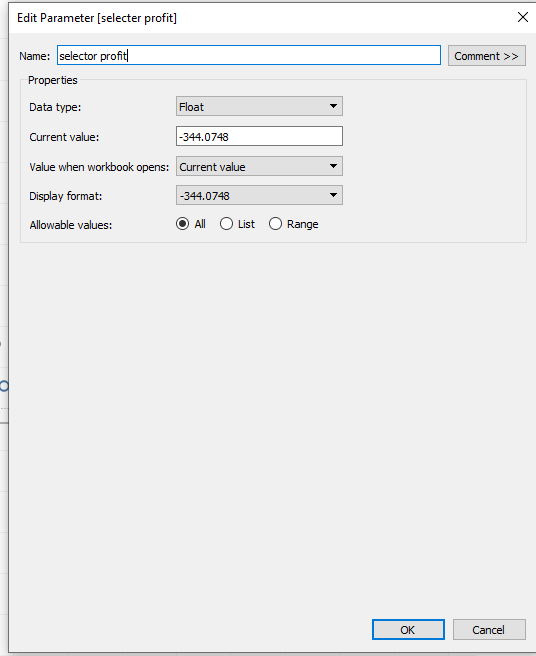
Now we need to create our 'selector profit' Float Parameter:
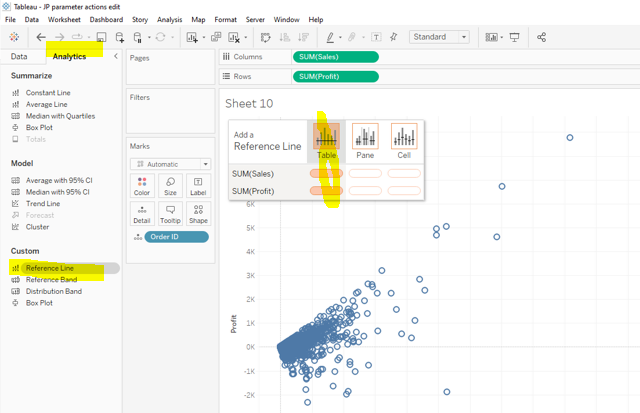
Then, under the Analytics tab we need to drag a Reference Line onto our graph for Table for both Sales and Profit:
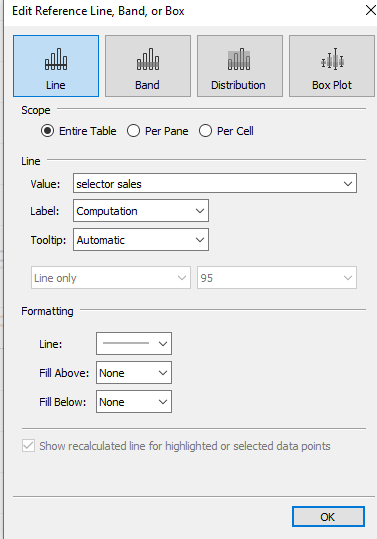
Right click on the Profit / 'y' Reference line and update the Value to be the selector sales Parameter:
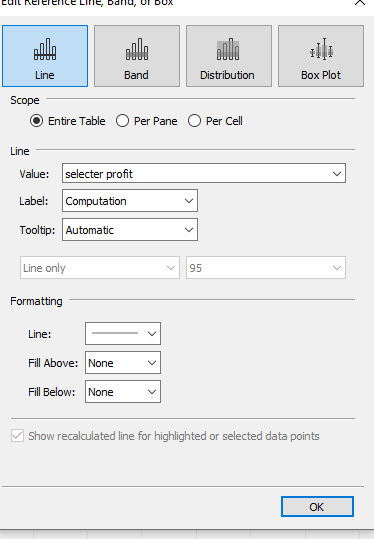
Right click on the Sales / 'x' Reference line and update the Value to be the selector profit Parameter:
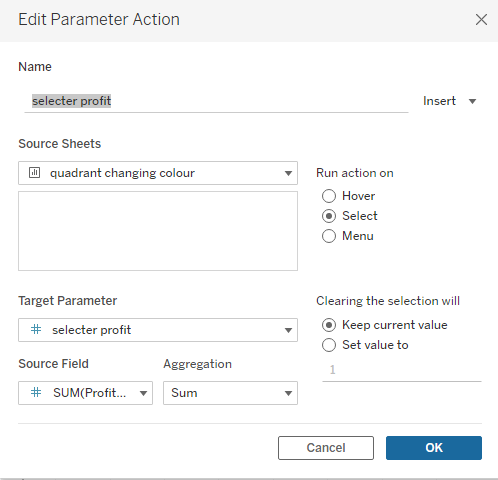
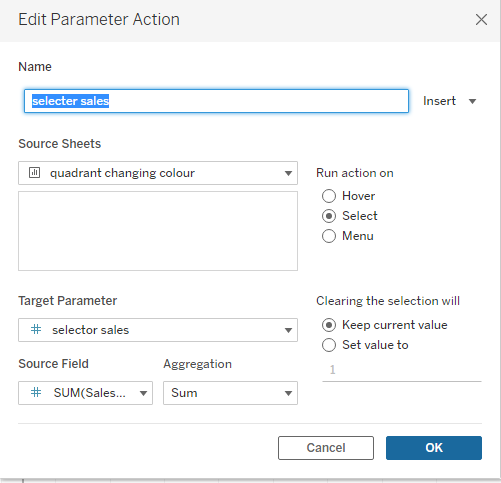
Now we need to create a Change Parameter action for this sheet under the Worksheet tab and call it 'selector profit':
Now we need to create a Change Parameter action for this sheet under the Worksheet tab and call it 'selector sales':
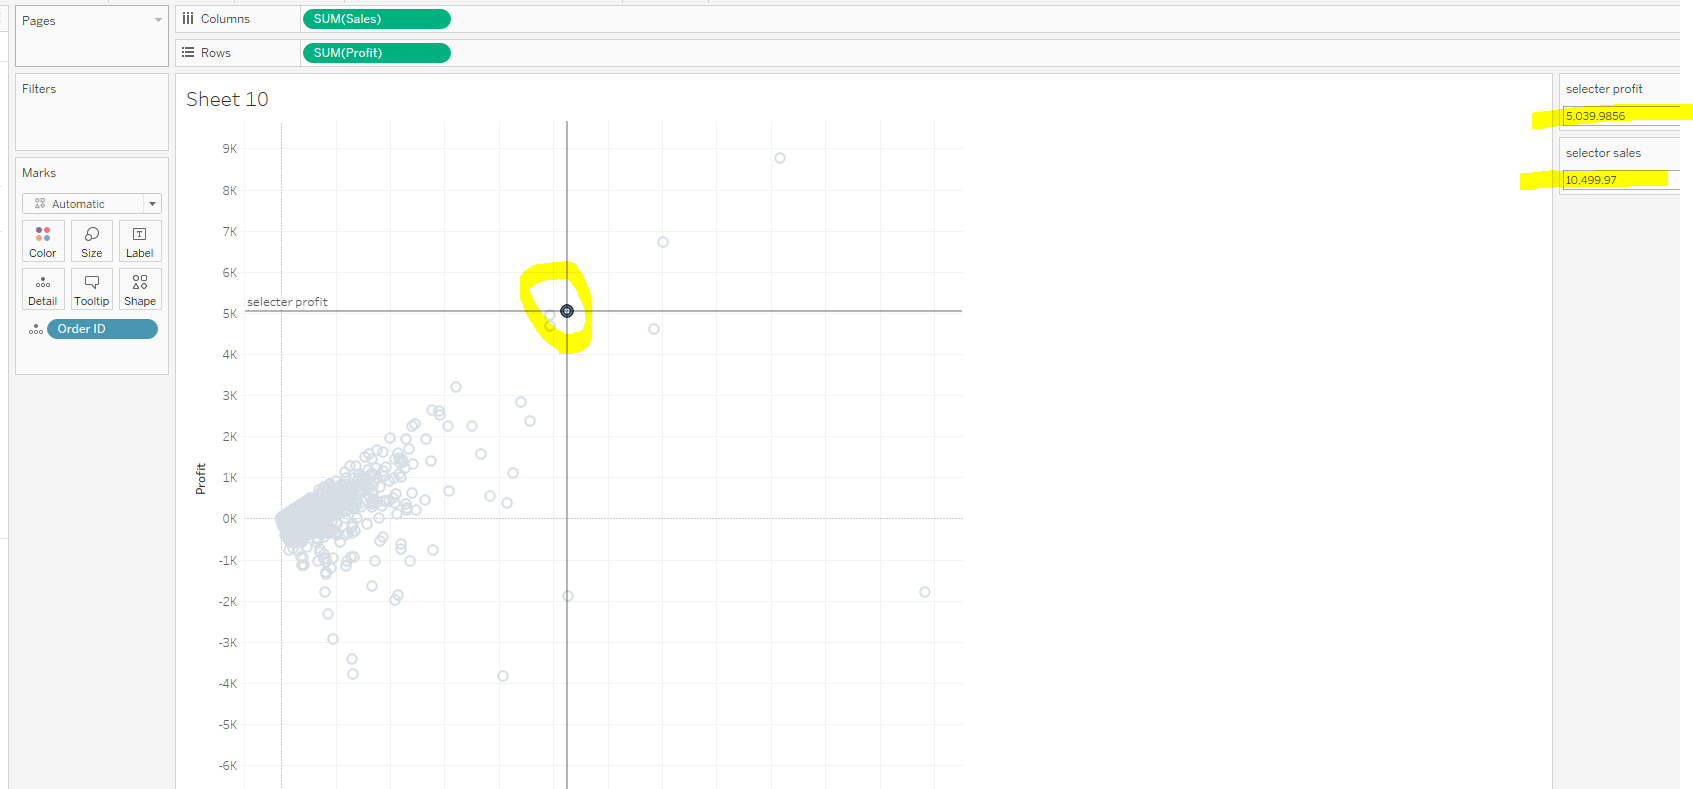
Right click and select 'Show Parameter' to show both the 'selector sales' and selector profit' Parameters. Now our Parameter will update as we click on each Order ID:
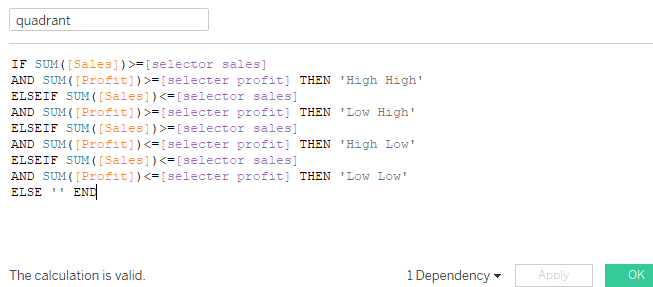
Now we need to create a new Calculated Field called 'quadrant':
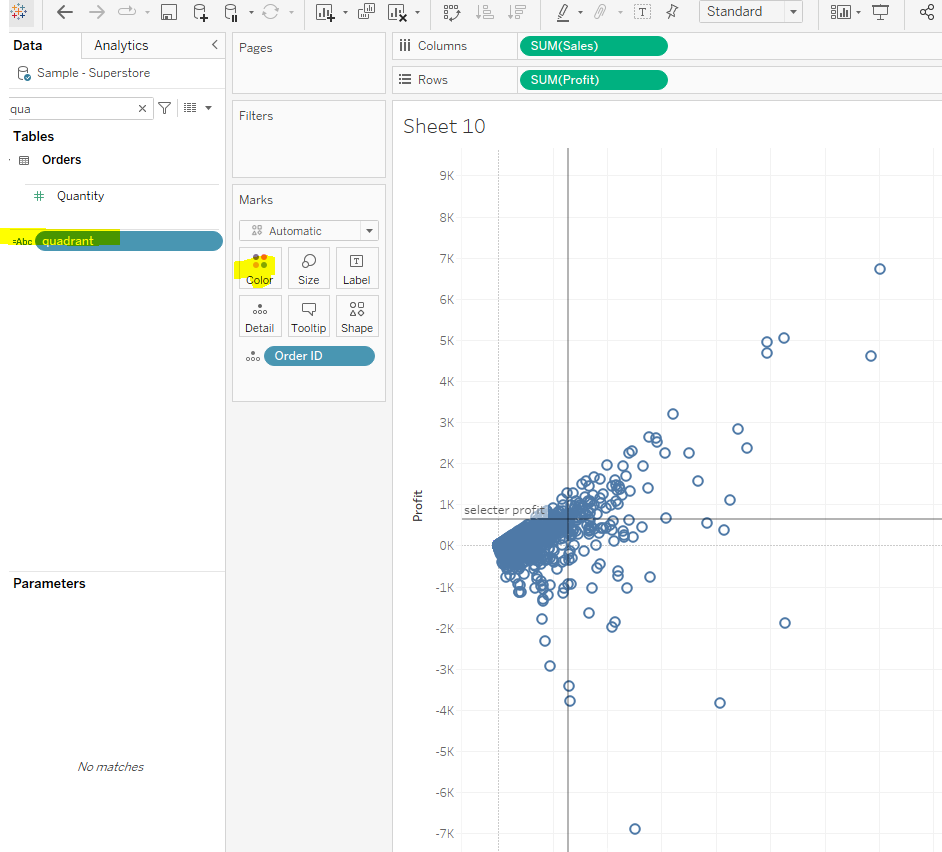
Once created move this onto Color:
Now each quadrant will update in color accordingly:
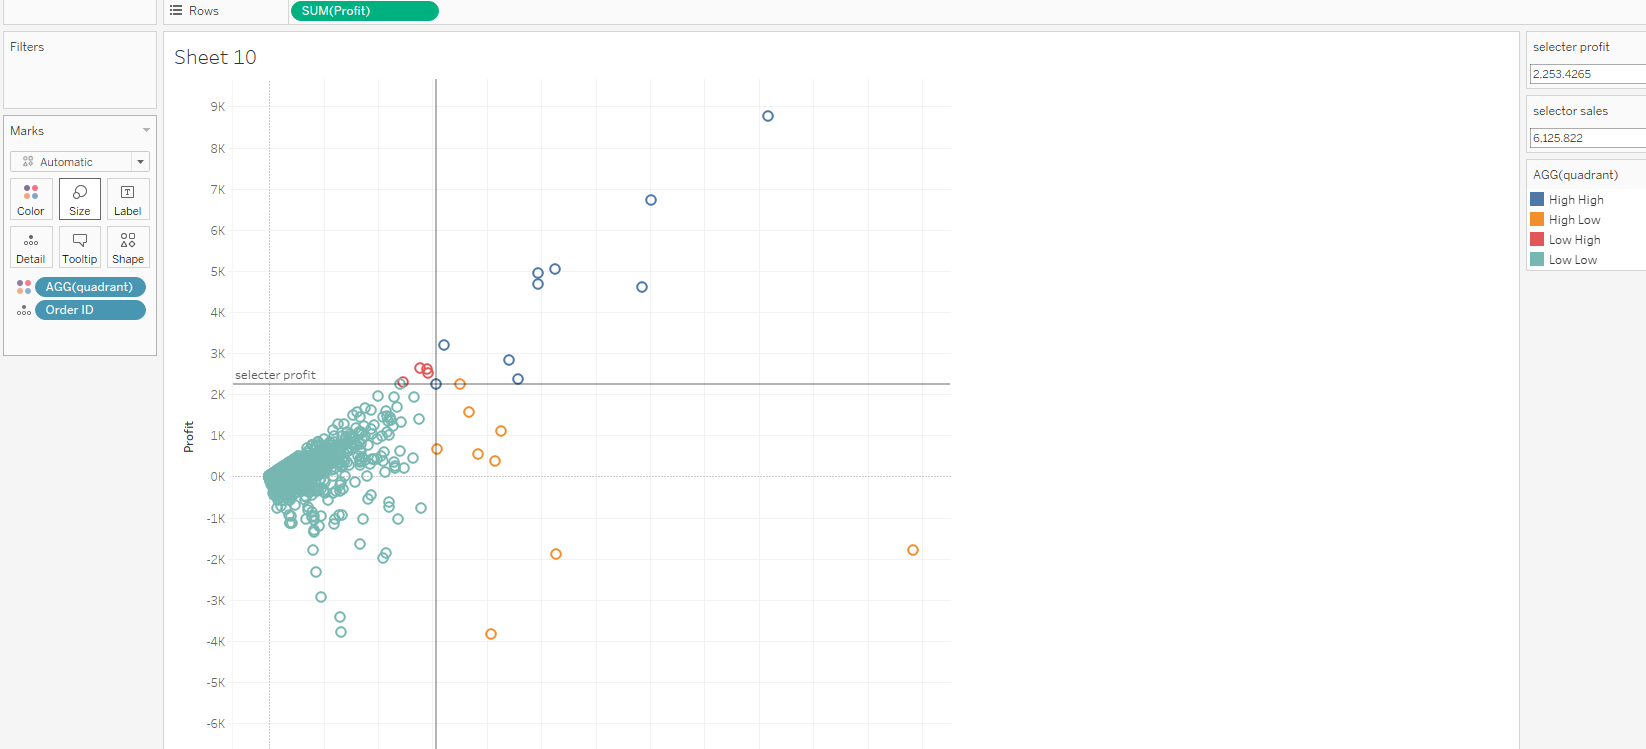
Currently when we select each Order ID, the unselected Order IDs will turn grey:
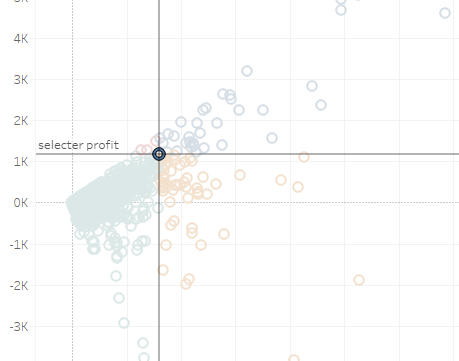
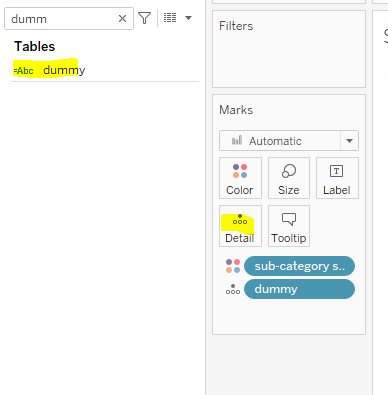
To prevent this we need to create a 'dummy' Calculated Field as below:

Drag this onto 'Detail':
Then create a Highlight Action for this sheet via the Worksheet tab as below:
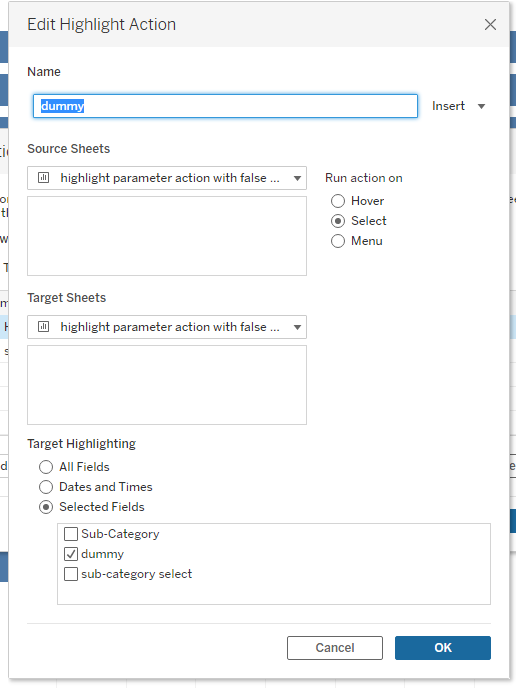
Now when we select each Order ID the unselected Order IDs do not turn grey.
