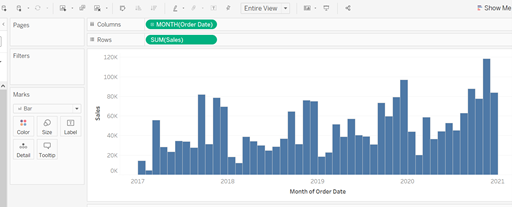
First of all, we start with a simple bar graph showing the SUM of Sales by Order Date month:
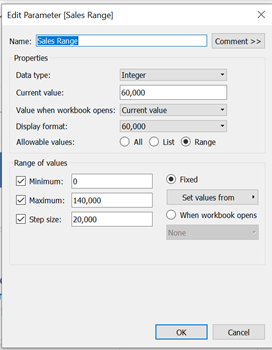
We then need to create an Integer parameter, for this example let’s call it ‘Sales Range’:
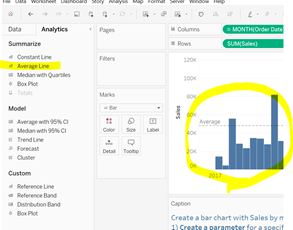
We now need to go to our ‘Analytics’ tab and drag the ‘Average Line’ onto our graph:
Right click onto the ‘Average’ line that appears and select ‘Edit’ to bring up the below window:
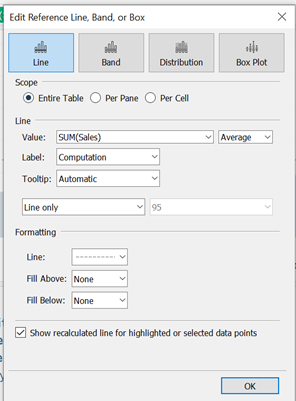
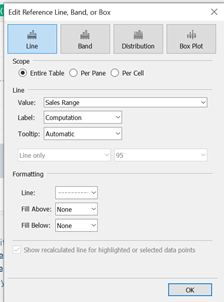
We then need to change the ‘Value’ to be the ‘Sales Range’ parameter that we have just created (you can also tweak the formatting to your preference):
On the ‘Data’ tab, you will then need to right click on ‘Sales Range’ and select ‘Show Parameter’:
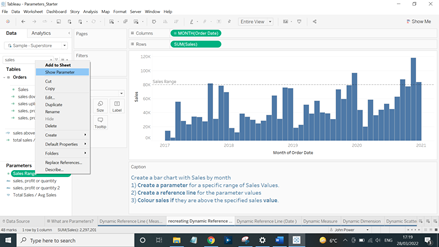
Now that the parameter is showing you will be able to adjust the ‘Sales Range’ and see the reference line move accordingly.
We now need to create a second calculated field to get our values that are above the ‘Sales Range’ to highlight in a different color. We will call this ‘sales above ref?’ and will need to reference our ‘Sales Range’ parameter:
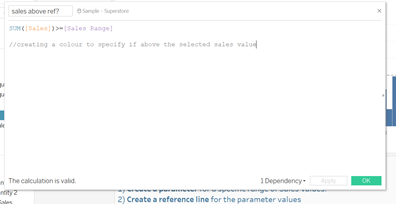
We then need to drag ‘sales above ref?’ onto color:
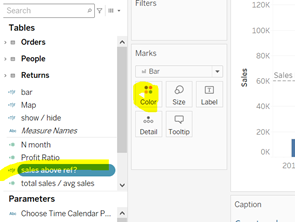
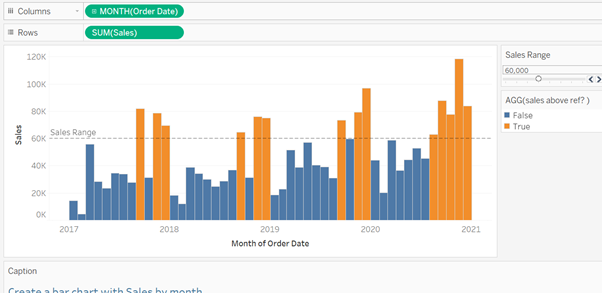
Now as we adjust our ‘Sales Range’, the months that are above our ‘Sales Range’ will turn orange and the ones below will remain blue:
