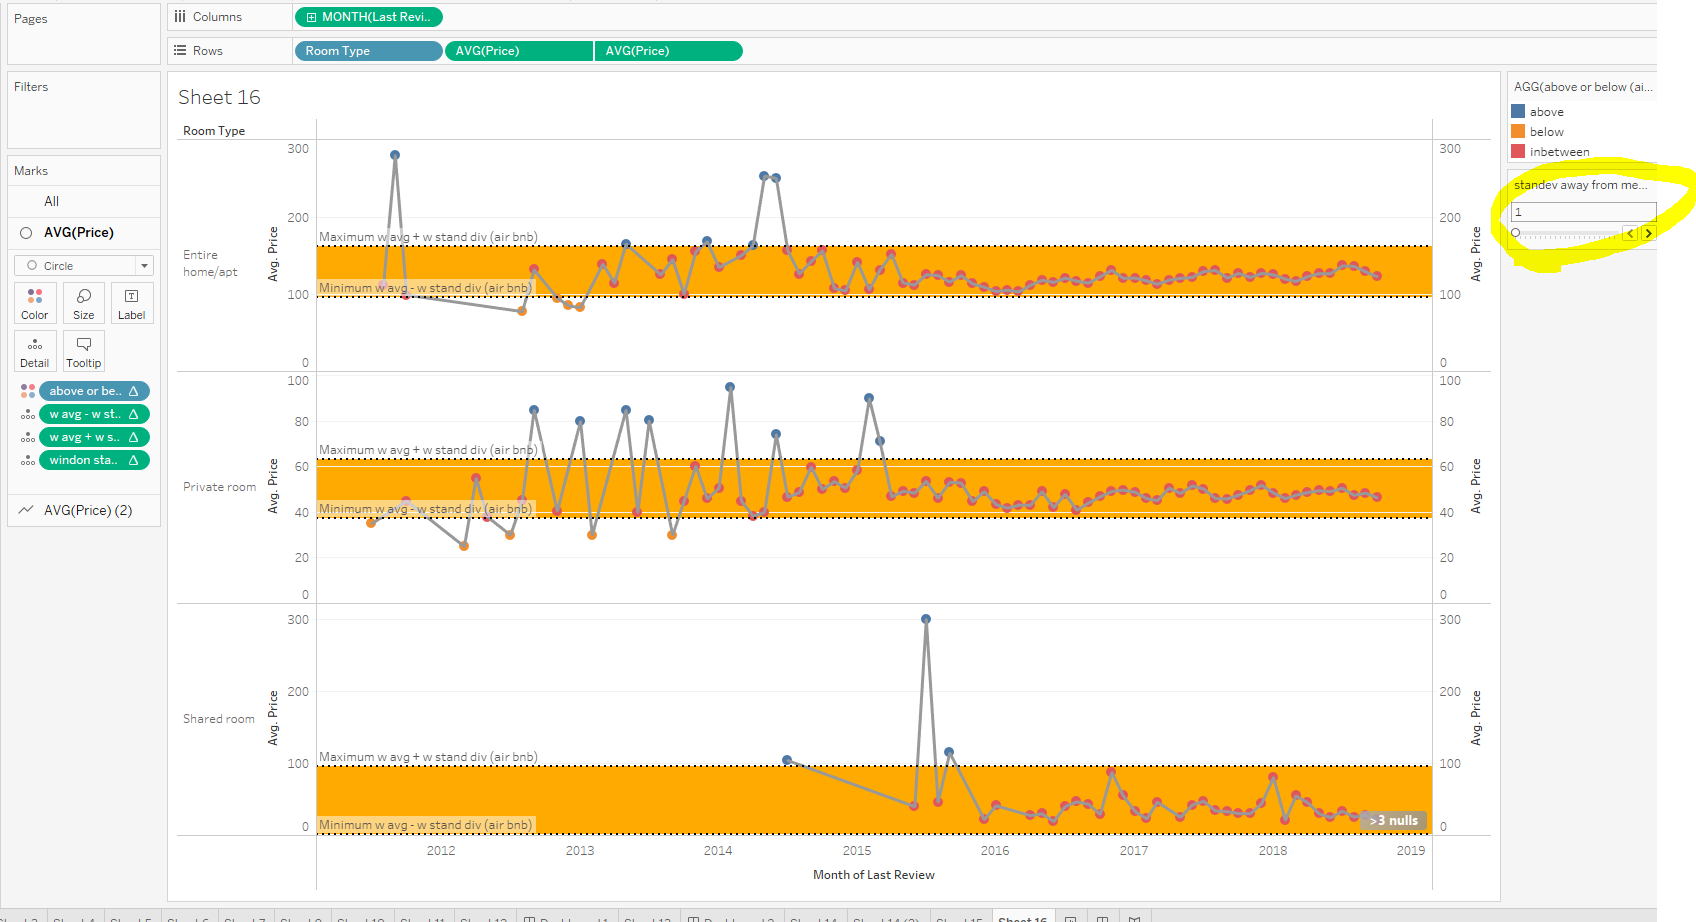
Finished graph:
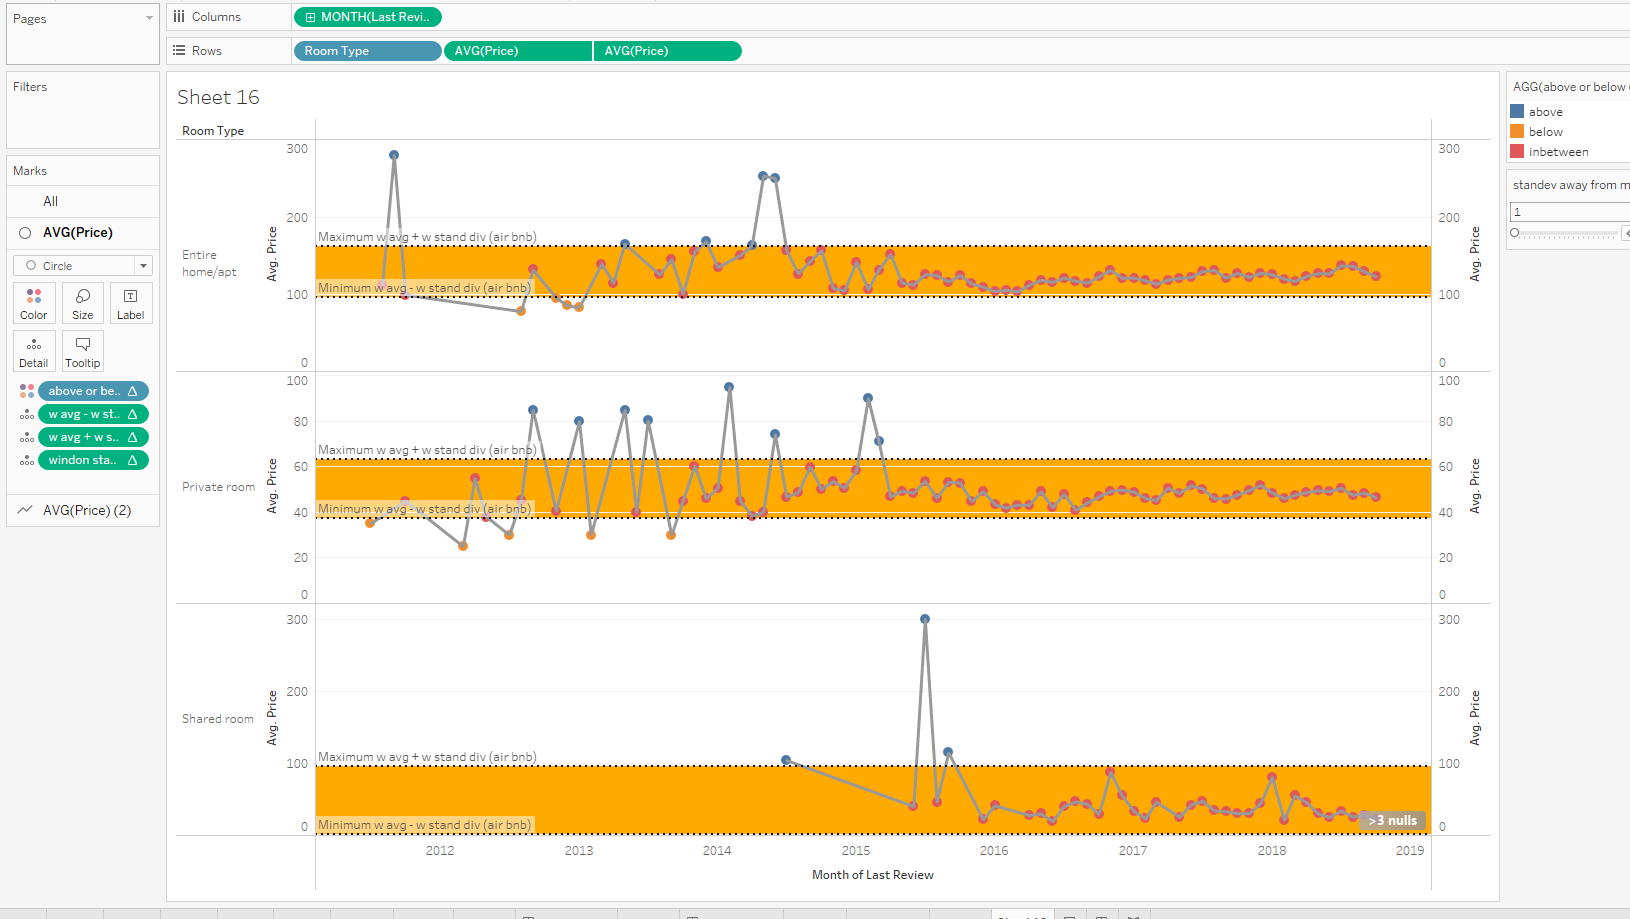
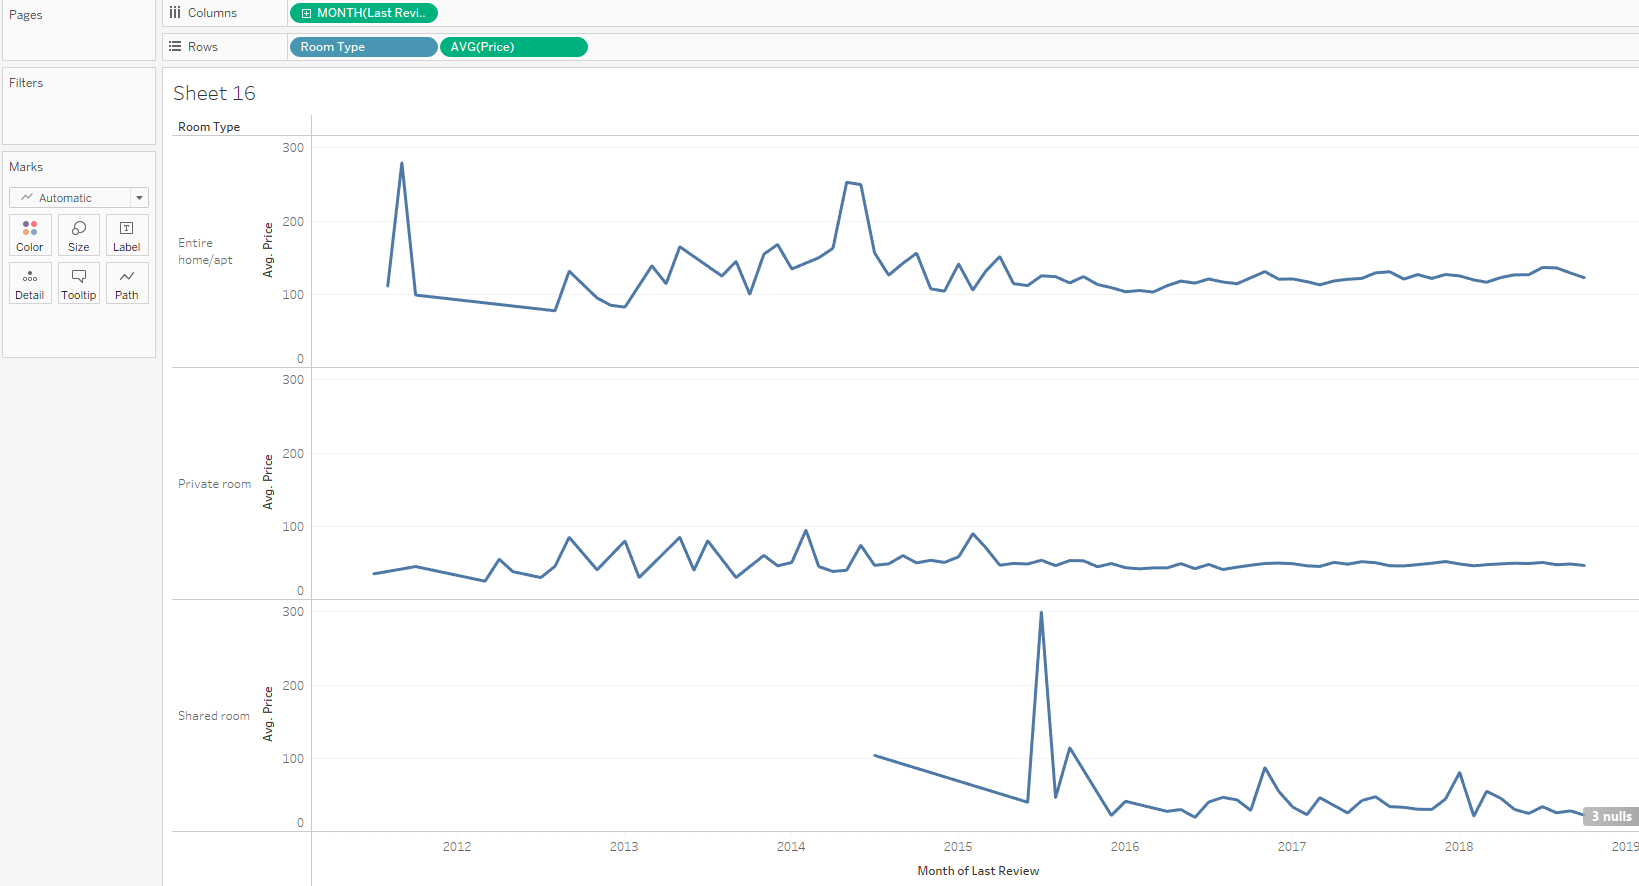
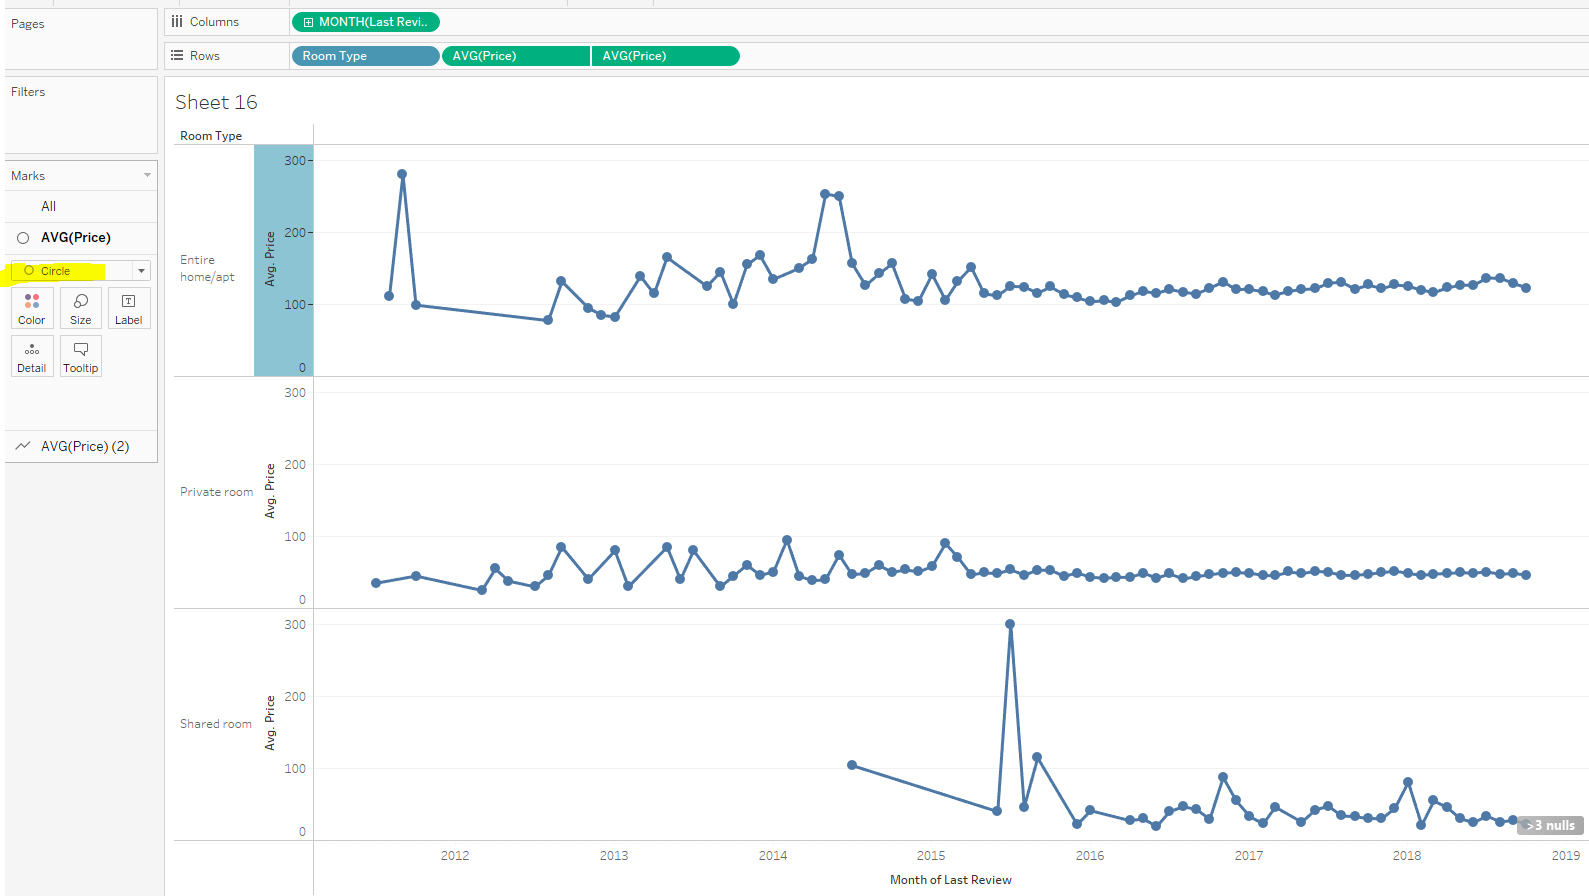
For this example we will be using the 'London Airbnb Listings' dataset, and we want to create a control chart showing average price over time, separated by room. First we need to drag MONTH(Last Review) onto Columns, and Room Type and AVG(Price) onto Rows:
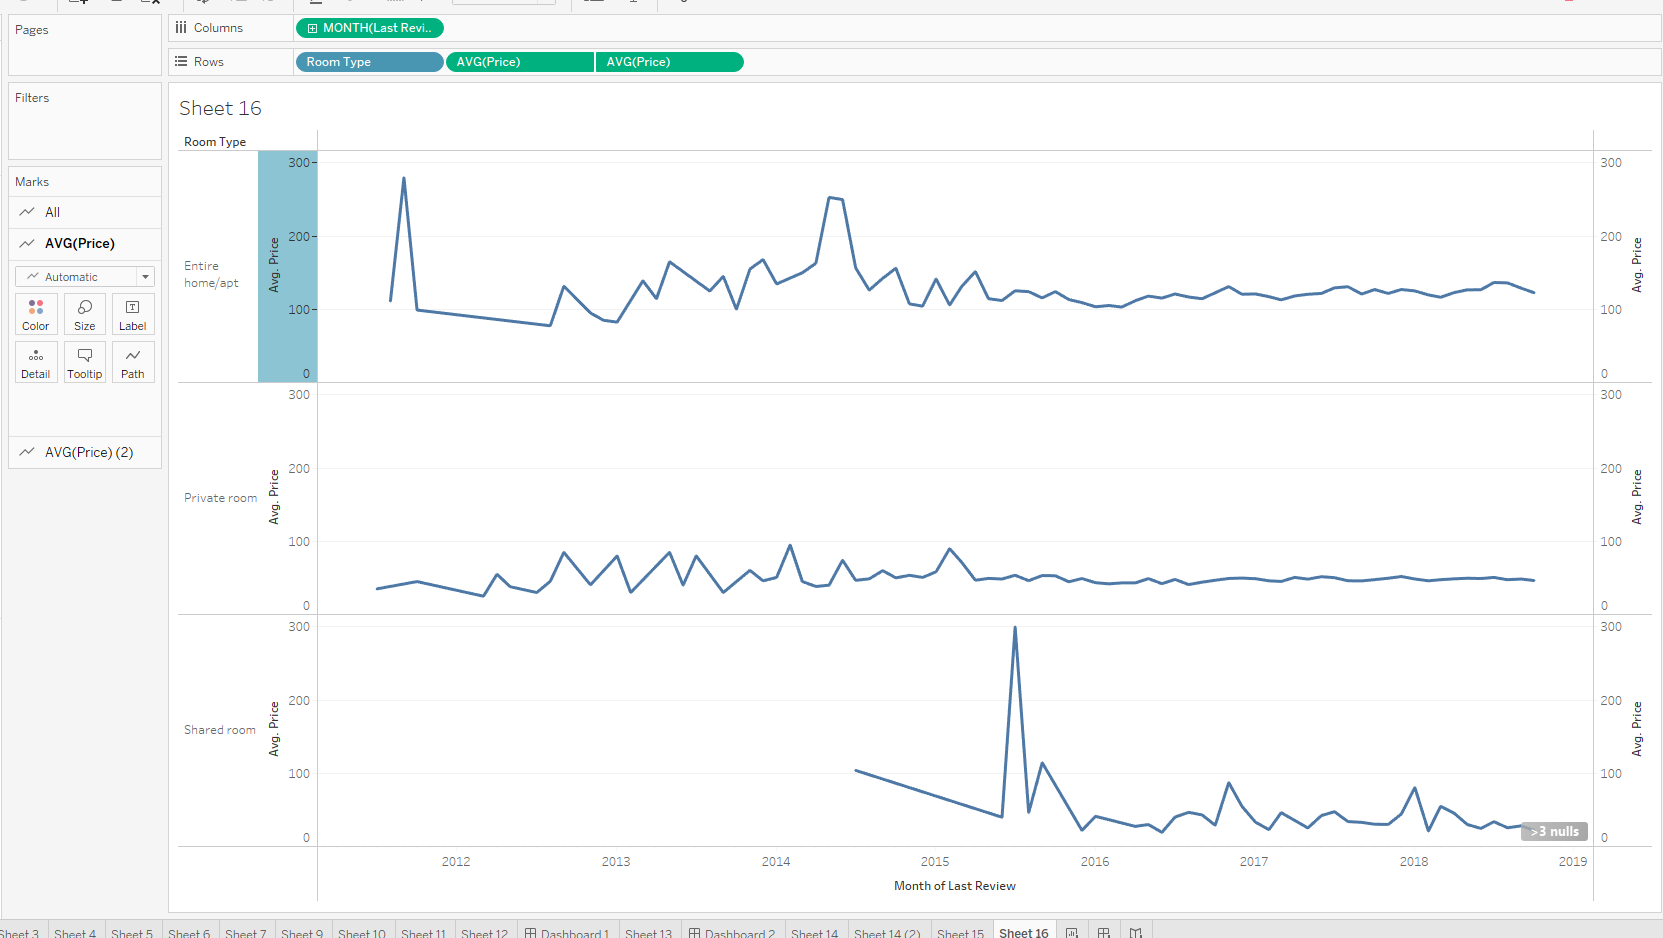
Now we want to Duplicate the AVG(Price) on the Rows, Right click on the 2nd AVG(Price) to create a Dual Axis, then Synchronize the Axis:
From here we want to change the 1nd AVG(Price) to be 'Circle':
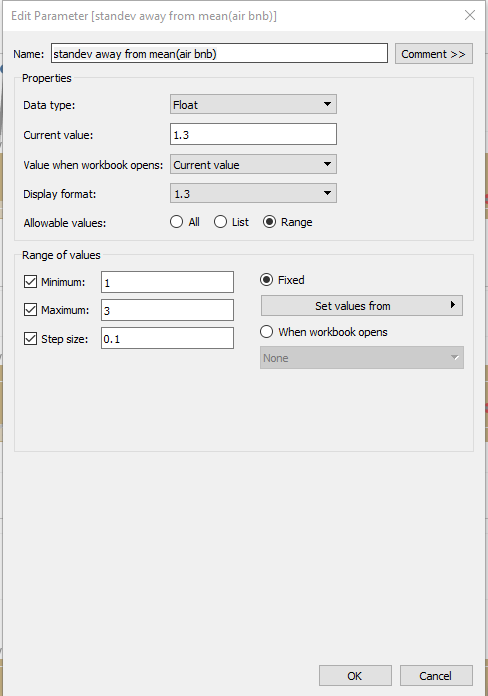
Now we need to create a parameter called 'standev away from mean(air bnb)', as below:
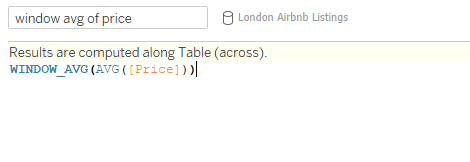
Now for our Calculated Fields. First of we want to create the 'window avg of price':
Now we need to create a Calculated Field for 'window standiv of price' as below:

Now we need to create a Calculated Field for 'w avg - w stand div (air bnb)' as below:

Now we need to create a Calculated Field for 'w avg + w stand div (air bnb)' as below:

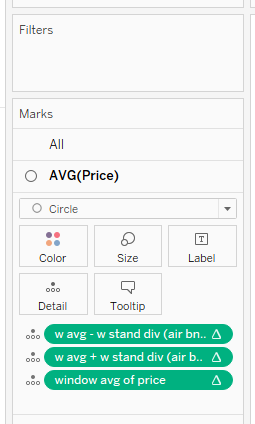
Drag 'w avg - w stand div (air bnb)' , 'w avg + w stand div (air bnb)' and 'window avg of price' onto the Detail for our 1st AVG(Price):
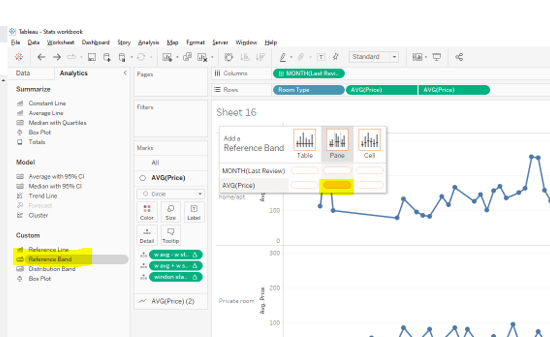
Then under our 'Analytics' tab we need to drag a Reference Band onto Pane for the AVG(Price):
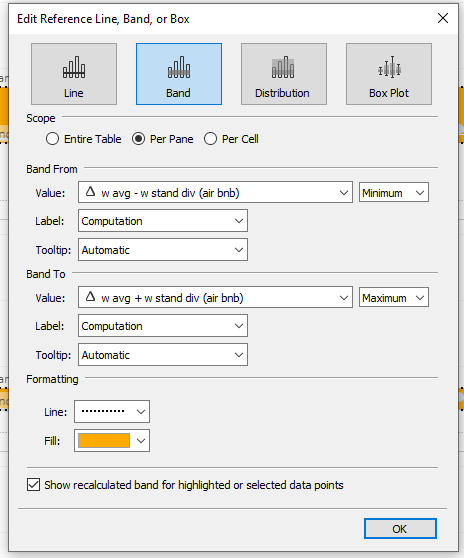
Now we need to update the 'Band From' Value and 'Band To' Value as below and update the Fill to Gold or another pretty color:
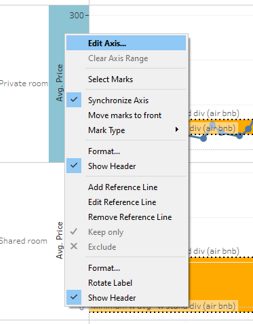
Right Click to Edit the Avg Price Axis:
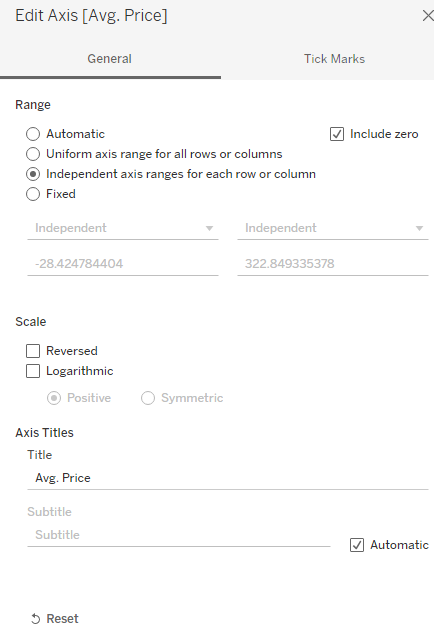
And set the range to be 'Independent axis ranges for each row or column':
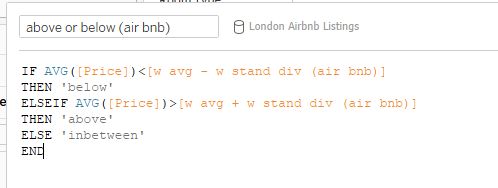
Now we want to create our Calculated Field for 'above or below (air bnb)' as below:
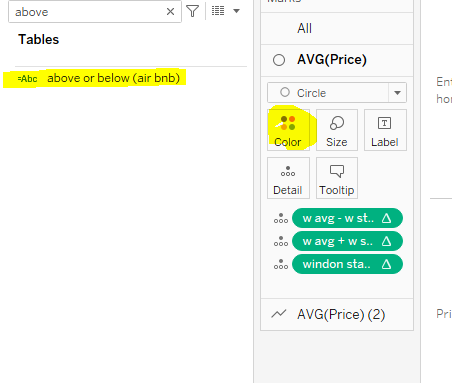
Once created, drag this onto Color for our 1st AVG(Price):
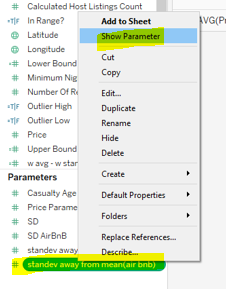
Right click on 'standev away from mean(air bnb)' to show the parameter:
Now, as we update the 'standev away from mean(air bnb)' parameter we can see the Reference lines update, and the colors change accordingly:
