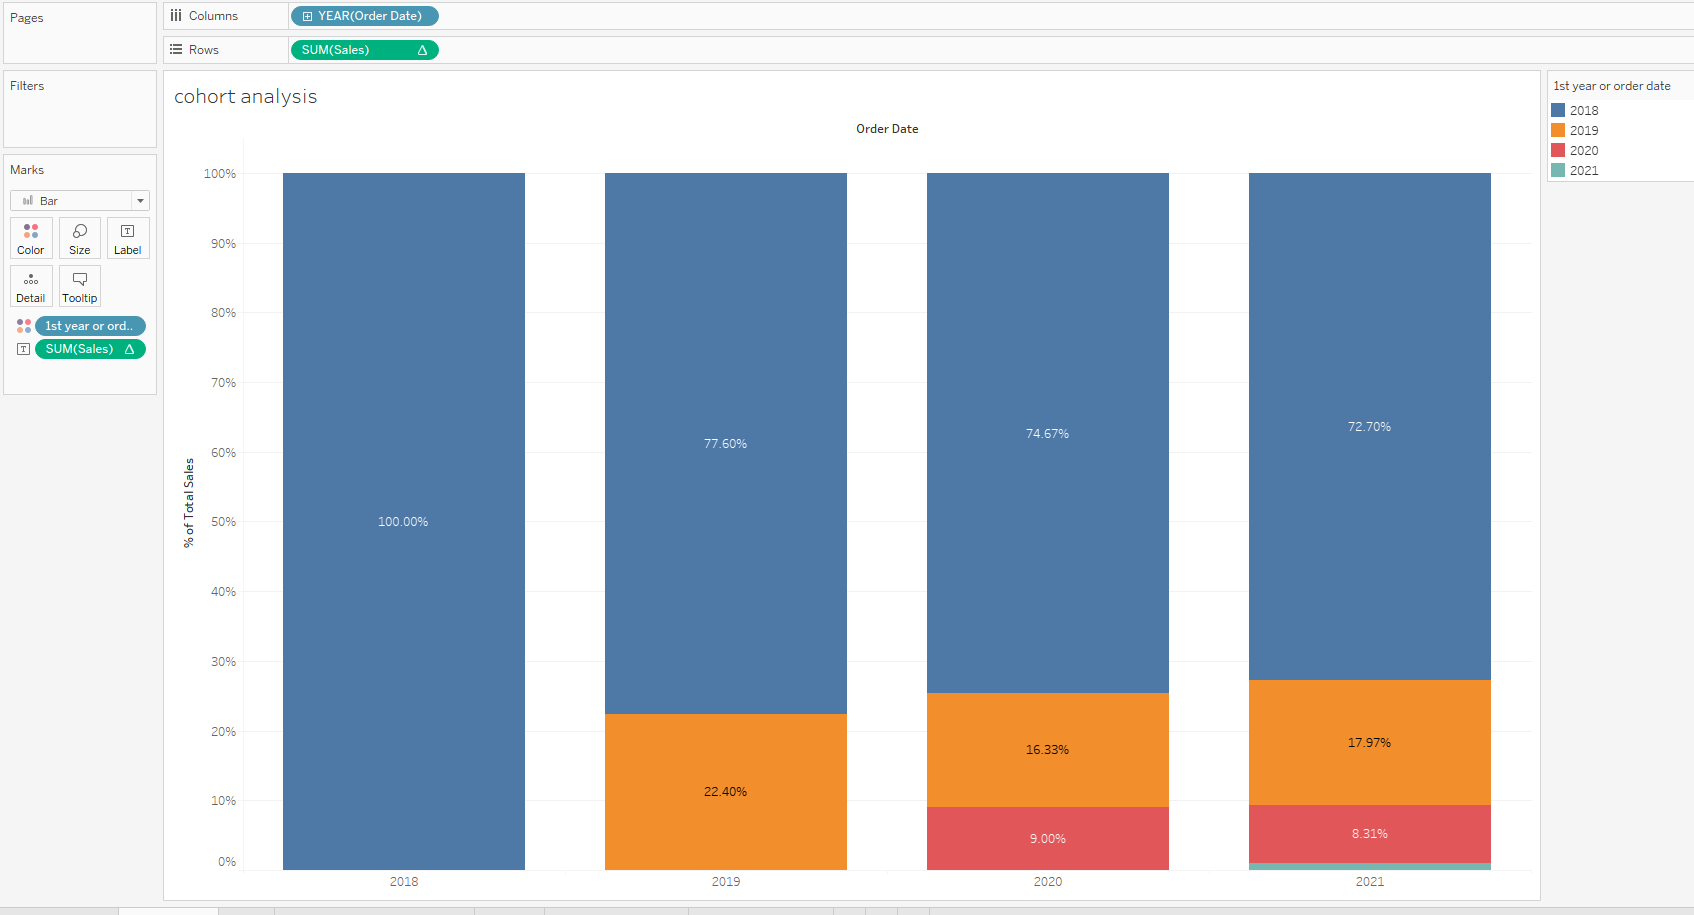
Finished graph:

For this example we will be using the Superstore dataset. First, we need to drag 'Year(Order Date)' onto Columns and 'SUM(Sales)' onto Rows and update to be a Bar Graph:

Then we need to right click on SUM(Sales) and under 'Quick Table Calculation' change this to be 'Percent of Total':

Now we need to work out whether it is the first year a customer ordered. To do this we will need to create and LOD calculation, FIXED at the 'Customer ID' level. Call this '1st year of order':

In English this is saying, for every single individual Customer we want to know the first year that they ordered. If this is not FIXED at Customer level it would just return us the Minimum year of the Order Date.
Using the FIXED LOD means that however we filter or slice up our graph this calculation will always apply to every single individual Customer.
Now we need to right click on '1st year of order' and select 'Convert to Dimension' as we want to group this rather than count this (for a further explanation of this please see: https://www.thedataschool.co.uk/skomantas-tamulaitis/blue-ang-green-things-in-tableau)

Now we need to drag our LOD calculation '1st year of order' onto Color:

Right click 'SUM(Sales)' and select 'Edit Table Calculation':

We need to change the 'Compute Using' to be '1st year of order' only. In plain English this is saying, for each Year of Order Date, we want the Percent of Total calculated by our 1st year of order Calculated Field. If we do not do this it will calculate the percent of total across all years rather than just the 1st year of order.

Lastly we can ctrl+left click and drag our SUM(Sales) onto Label so we can see our percent displayed on the label:

For more background on summarizing FIXED LODs and Table Calculatations please see the below blogs by Andy Kriebel:
