Calculated fields allow us to create new data from the data that pre-existed in our data source. They can be aggregate level, or row level, but never both together in the same calculated field. By what do we mean when we talk about aggregate level and row level?
Below we have a simple table depicting a list of sales shown by state:
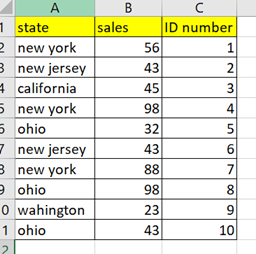
We can already see that the majority of states listed here appear more than once. If we wanted to see by state, who sold over 50 in total we would need to create an aggregated calculated field based on the SUM of sales by state:
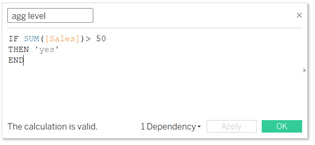
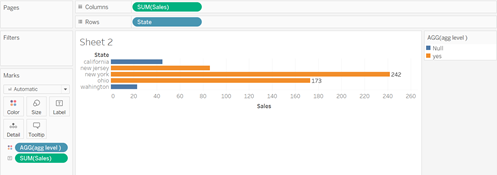
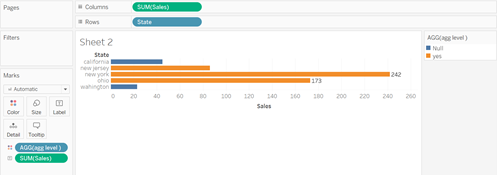
Once we drag this calculated field over to color, we can see in orange the states in which the SUM of total sales are over 50:
But what if we did not want to see this as a SUM? What if we wanted to keep our data unaggregated? What if we wanted to see at row level the amount of sales by state that are over 50?
Lets go back to our original table to explain what we are after:
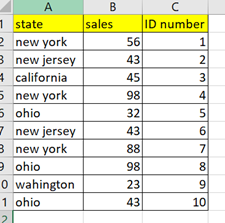
We can see the Ohio has three separate entries for sales - 32, 98 and 43. In our first calculated field we wanted to see the SUM of this, so we wanted to see 32 + 98 + 43 = 178:
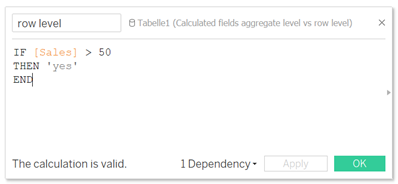
But now we want to see of all the 178 sales, how many were greater than 50. For this we need to use a row level calculated field:
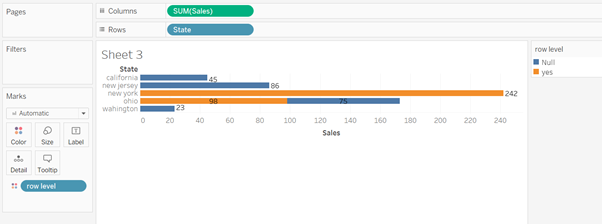
Once we drag this calculated field onto color and add the labels we can see that of the 178 sales for Ohio, 98 were over 50 (shown in orange) and 75 were under 50 (shown in blue):
Being able to create aggregate level or row level calculated fields gives us flexibility in how we analyze our data and therefore lets us tackle a greater range of potential issues or questions.
