


Find the association analysis tool under the developer tab, attach browse tools to the output and connect in an input and select the fields that you want to see correlations between.

When the workflow is ran and the browse tool is selected the following grid is created.
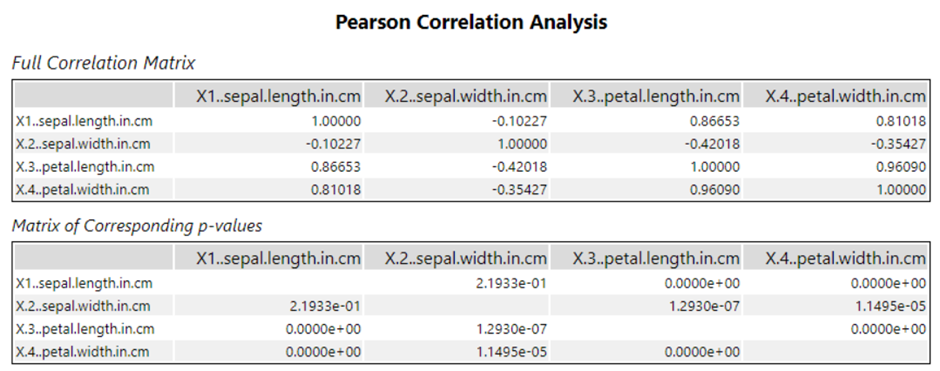
The full correlated matrix is populated by the Pearson correlation values. The values can range from -1 to 1. The closer the values are to the extremes (-1 or 1) the stronger the correlation is. By a rule of thumb if the value is above 0.7 or below -0.7 the correlation may be considered.
In the bottom chart the values populating the chart is the p values where you want the value to be as close as possible to be 0. The p values essentially means the chance that the correlation seen is random. E.g. if you only look at 3 people who are 7 feet tall in Sierra Leone you may think that people form Sierra Leone are all very tall however this would have a low p value because in actuality the average height will not be significantly different that the average height of all people in the world. The P value essentially says is this correlation seen random because you are seeing outliners.
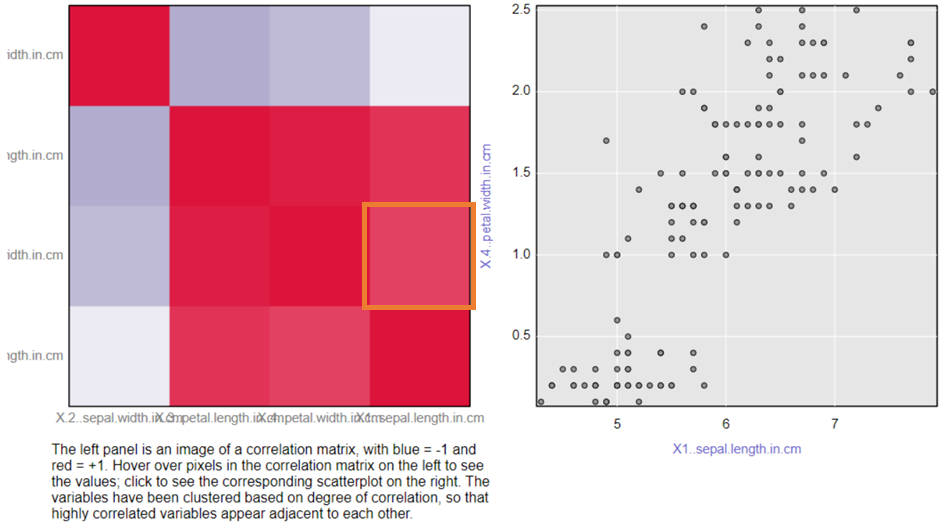
The left matrix is the first chart as a heat map with red being +1 and deep blue being -1.
When clicking on a square within the matrix you filter to see that relationship on the right chart. This chart shows the width of a petal and the length of a sepal which a part on a plant. We see that there is a strong correlation as the Pearsons value is 0.81 and the P value is 0 so this is not random.
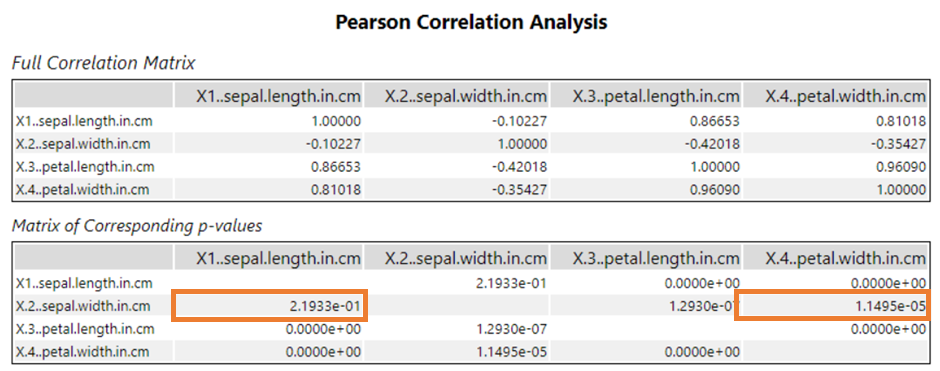
However you must be careful when looking at either value isolates as individually they can be misleading. E.g. the highlighted call on the right the p value is very small and less than 0.05 showing the relationship is not done randomly however the correlating Pearson value shows there is a very weak/almost nonexistent correlation. The p value on the right is above 0.5 and is proven to be random and the relationship is also weak. Although not in this data set there could be a very strong correlation proven by a high Pearson value however this could be random as it is a small representation of the overall data as would be expressed with a large p value.